Stories/Visualizations
Overview
Stories in SenseOps UI Builder are individual charts, tables and KPIs which can be added to boards. SenseOps UI Builder allows it's users to either import stories directly from Qlik sense or create custom stories as per user needs.
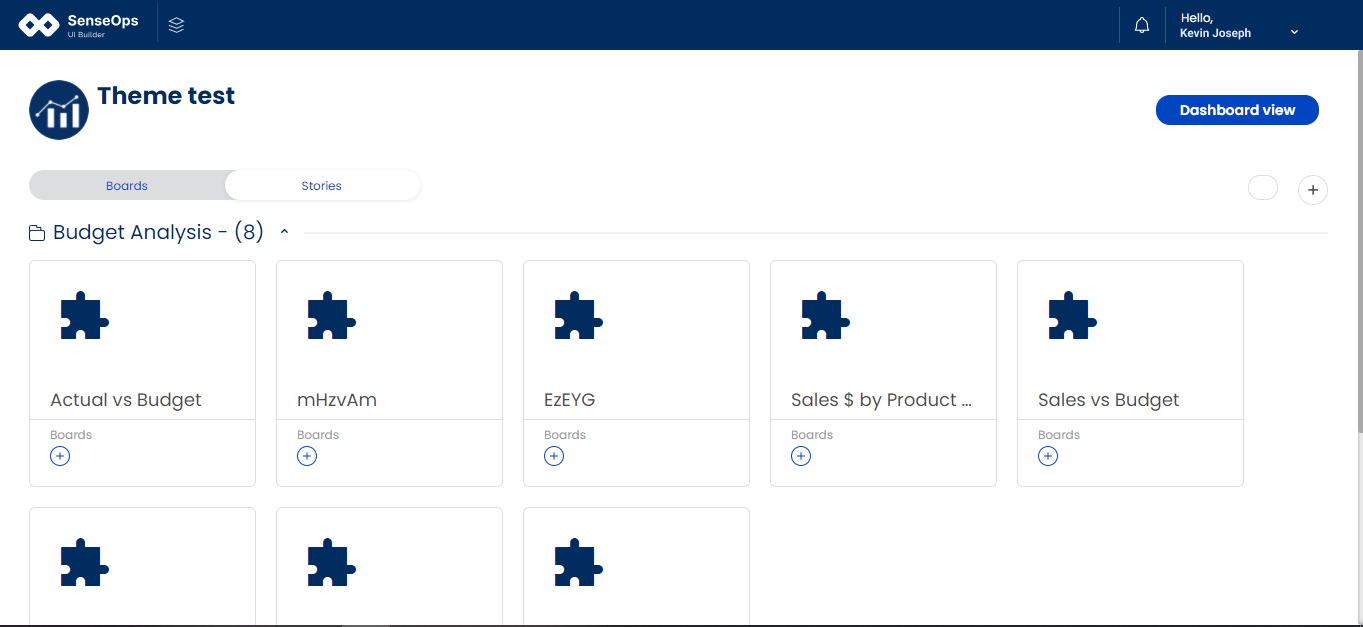
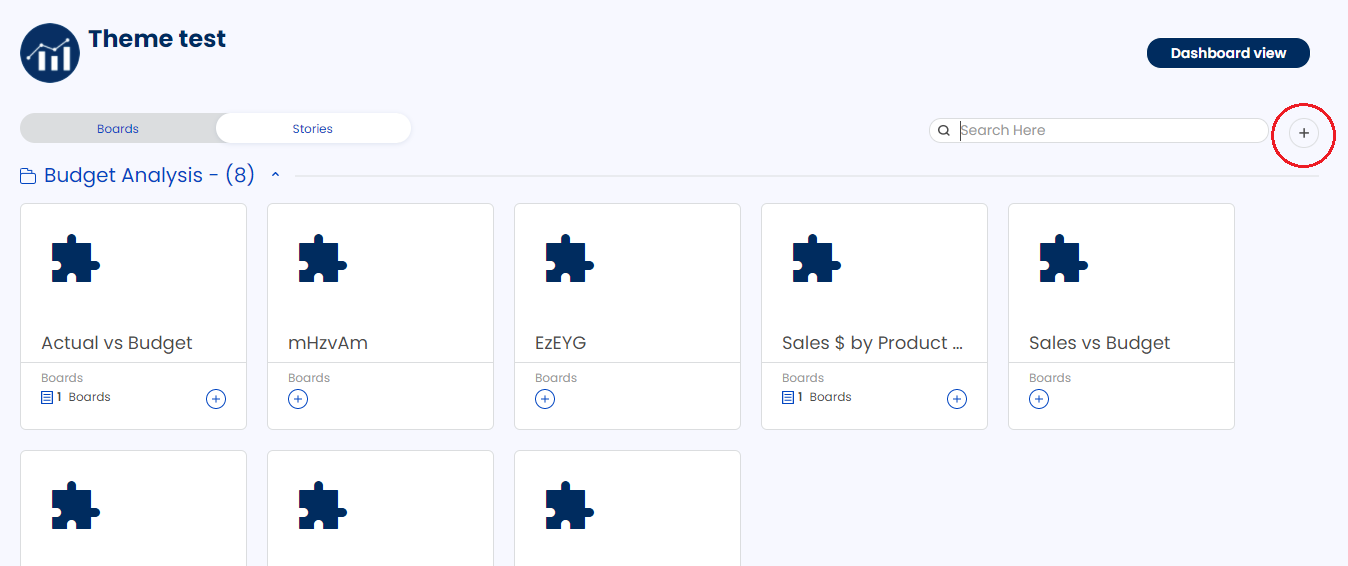
Navigate to Customize boards page and click on Stories tab to view all the stories available.
The following section, we'll look at the basic operations that can be performed on stories.
Basic Operations
Adding new stories to the board
There are two ways a user can add stories to the board
Adding stories directly to specific boards from the story list.
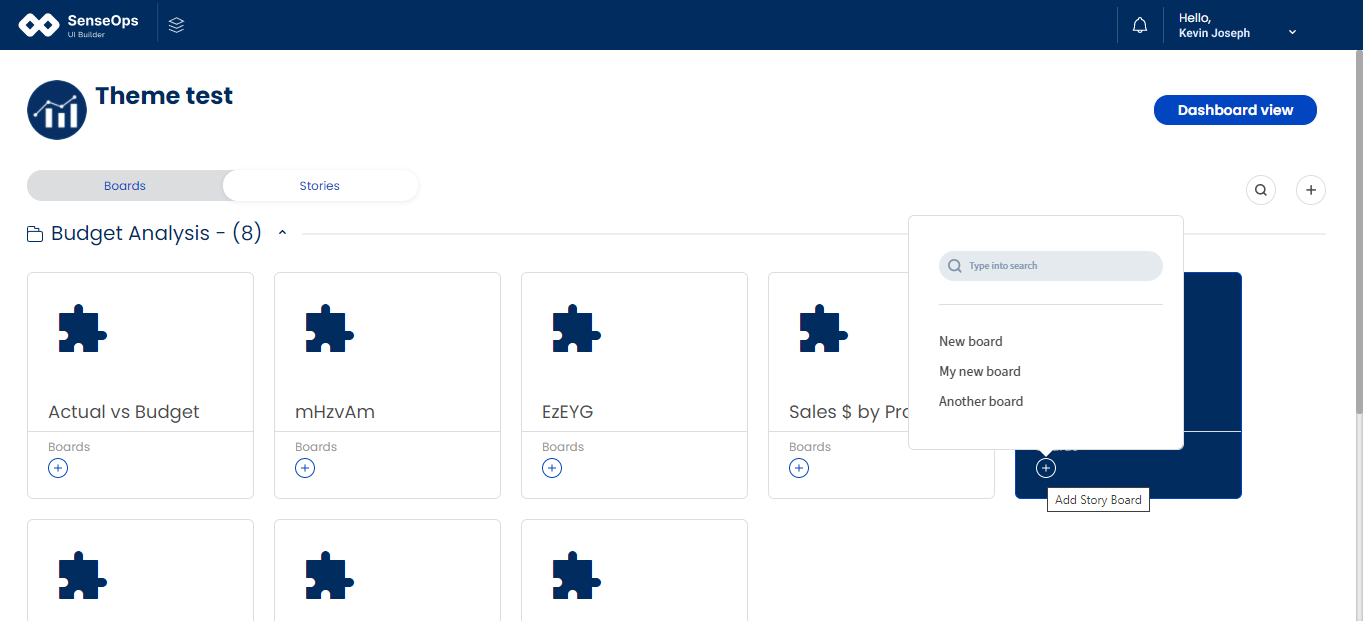
For this user needs to navigate to the 'Customize boards' page and click on the Stories tab. Then click on the + icon on any story which he/she needs to add. Using the dropdown list of available boards, users can add the story to a particular board they need. When the user opens that particular board, the story he/she added will be present in it.
Adding stories from the boards.
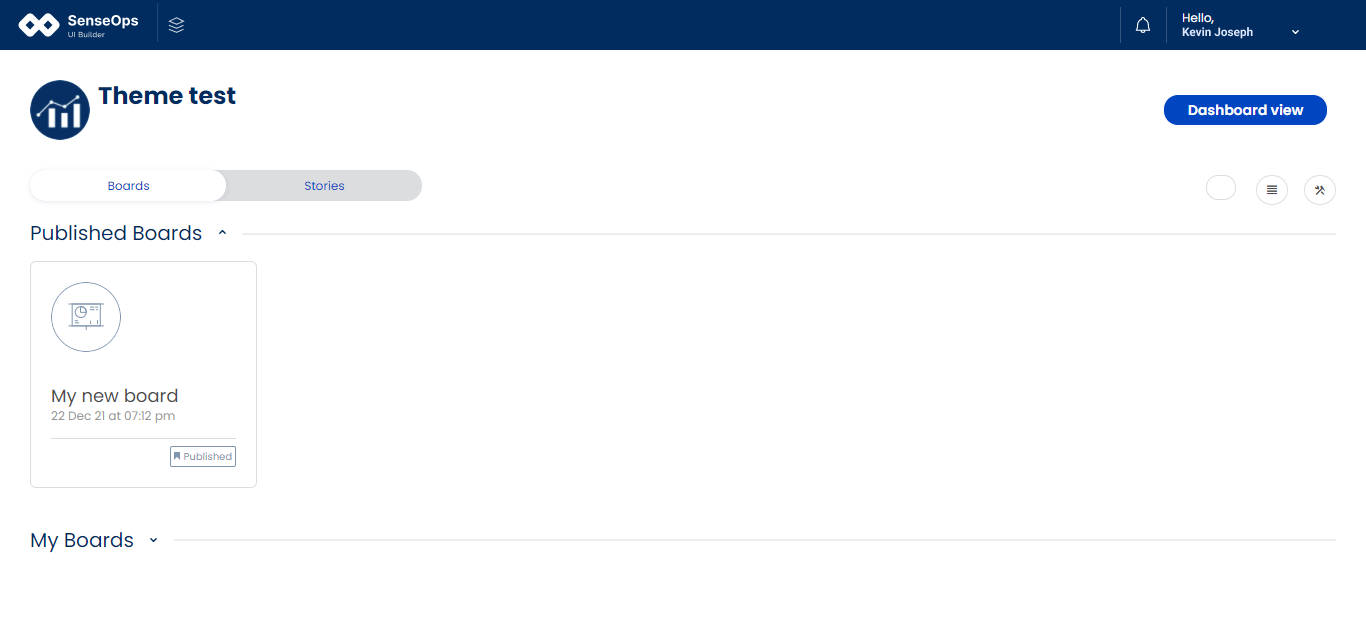
User can add stories inside a board in which he/she is working on. For this user needs to navigate to the Customize boards page and click on the Boards tab. From the boards list click on any board to open it.
Once the board is opened, you can find a New stories button on the top of the page below the header. There's also a grid down below naming 'New stories' to add a story to the board. Click either of them to add stories.
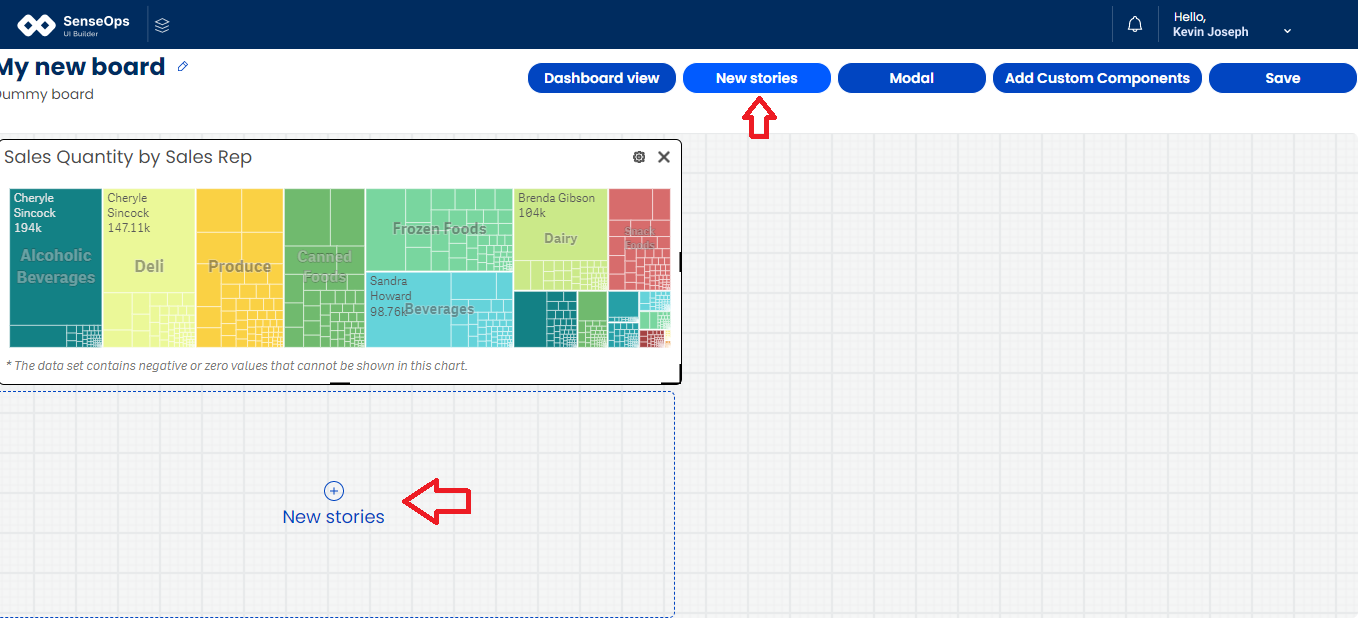
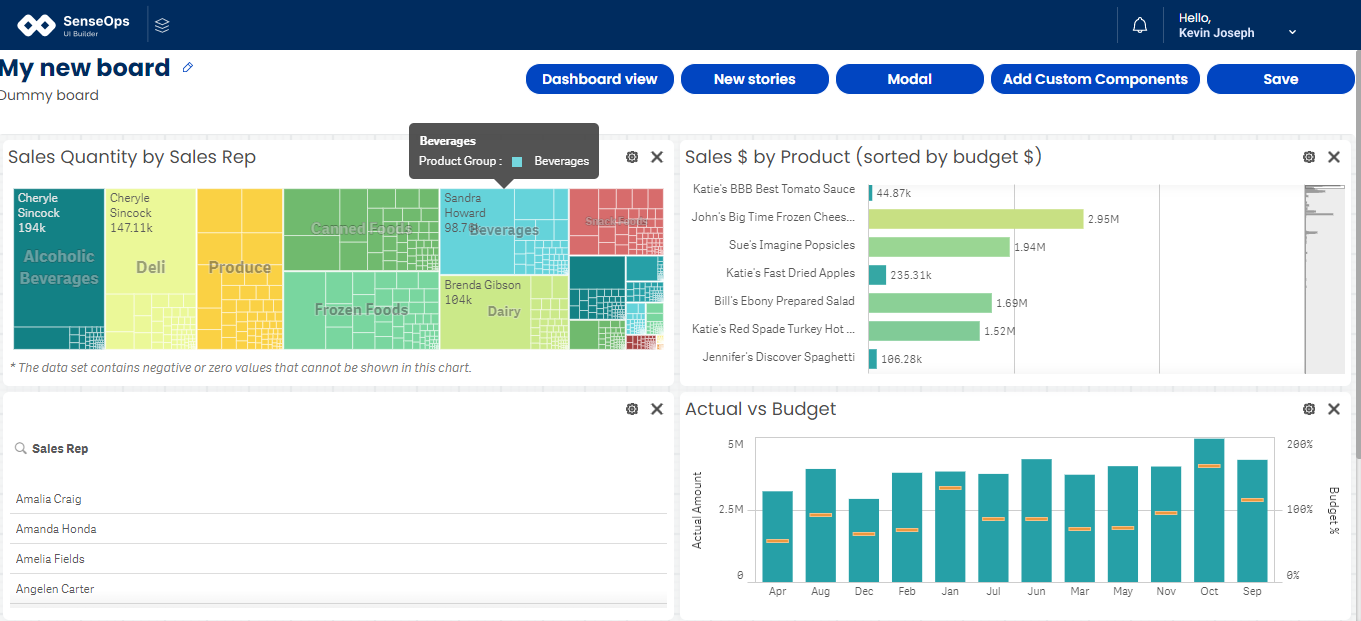
When the New stories button is clicked, a popup modal will open with all the available stories segregated by their groups. Now open any group by clicking on it, select the stories you want to add and close the modal. The stories you selected will be added to your board.
Modal settings
Modal settings allows user to write expressions to trigger the modal to display the data when necessary conditions are met. User can also configure events to execute when modal is closed.
To configure modal, follow the steps below
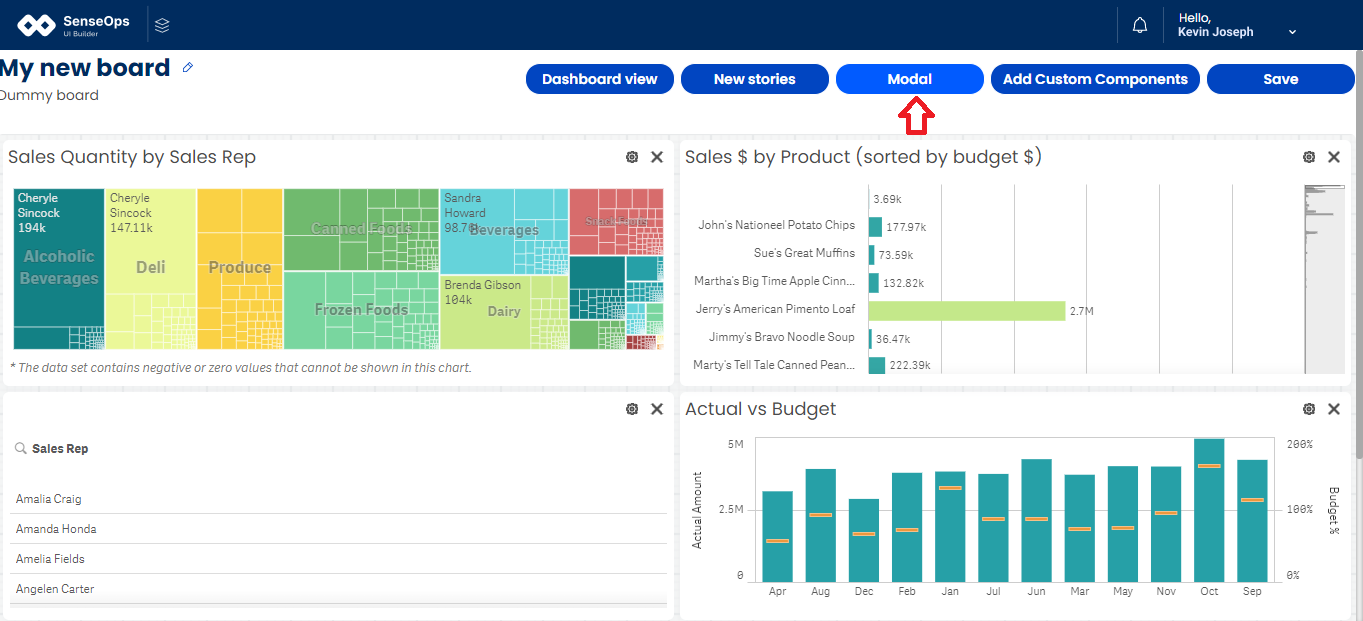
Click on the Modal button on the top.
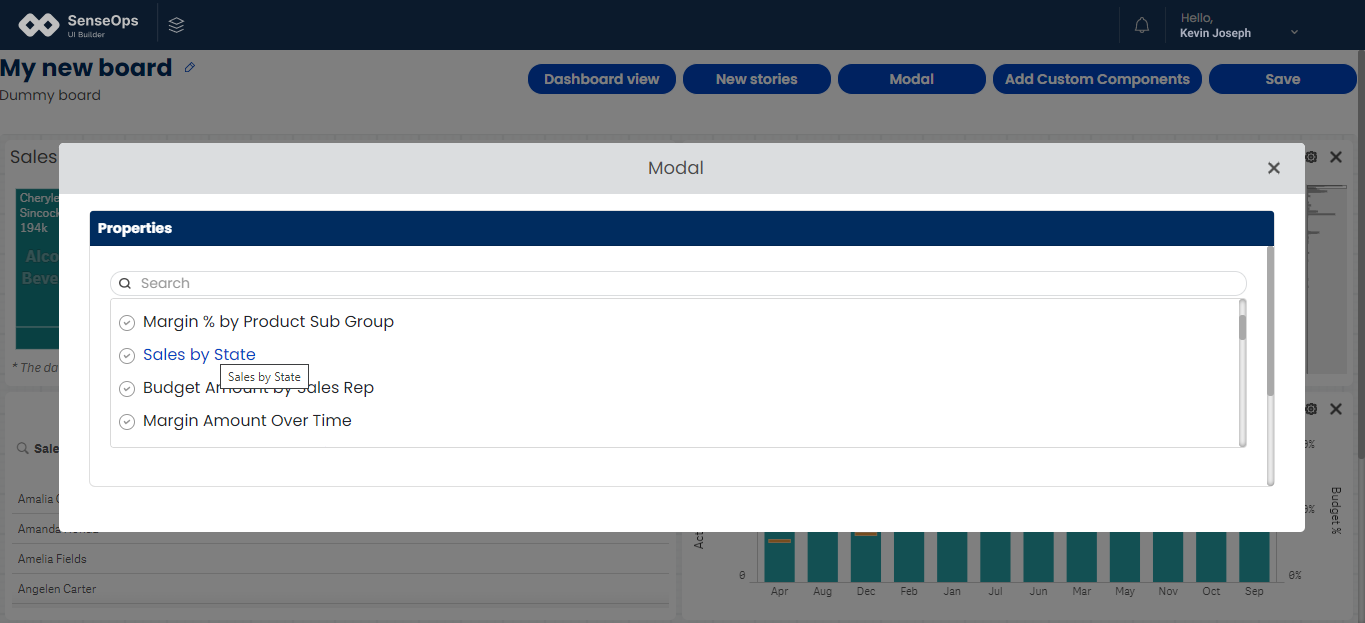
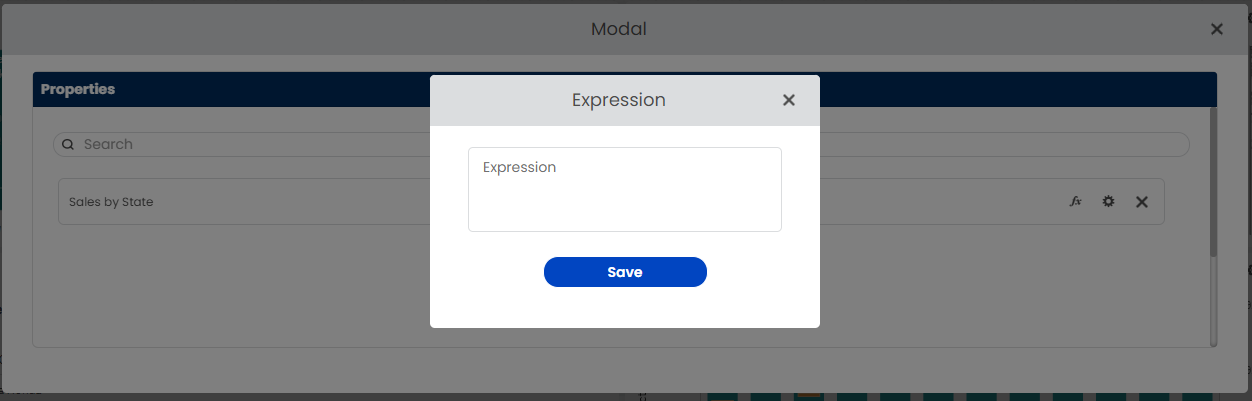
Now select the properties from the search box to add to the modal.
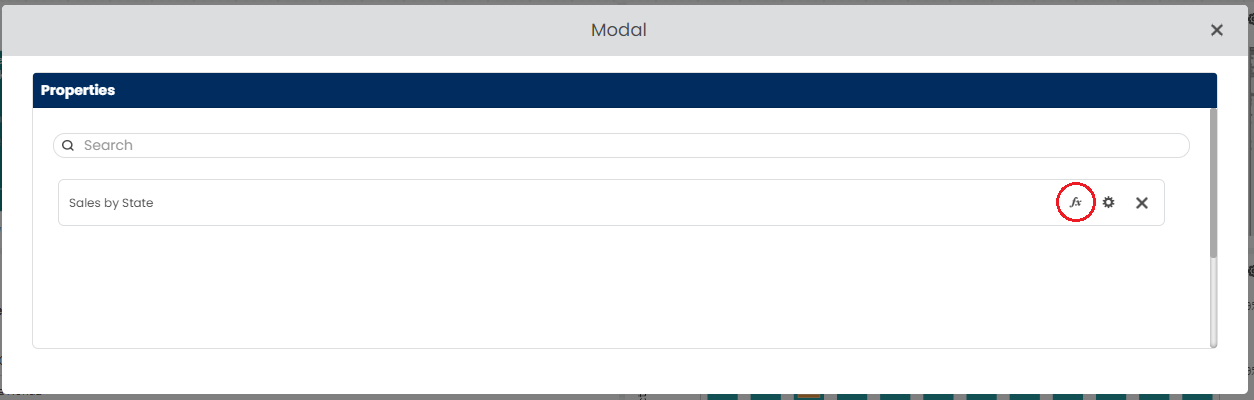
Once you select the property, click on the 'fx' icon for writing expression to execute and click on Save.
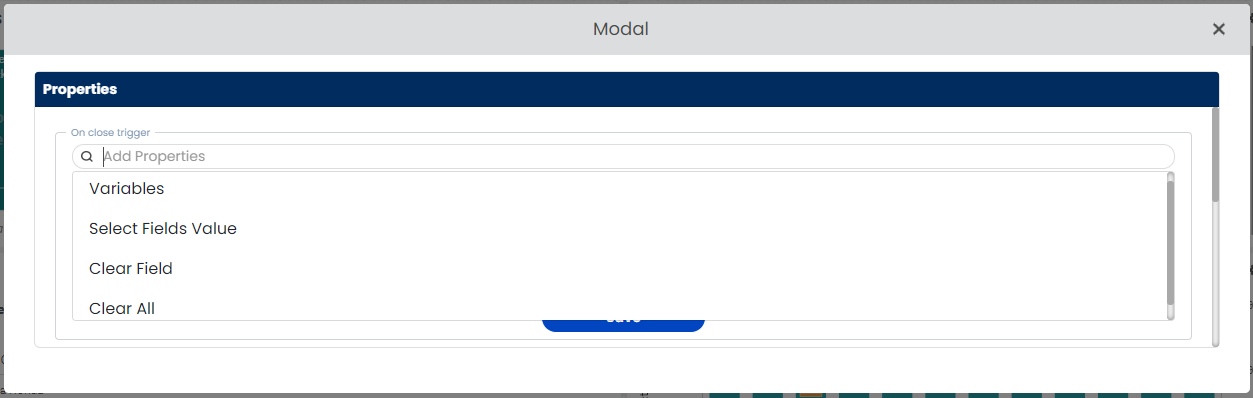
Now click on Settings icon for modal on close trigger setting.
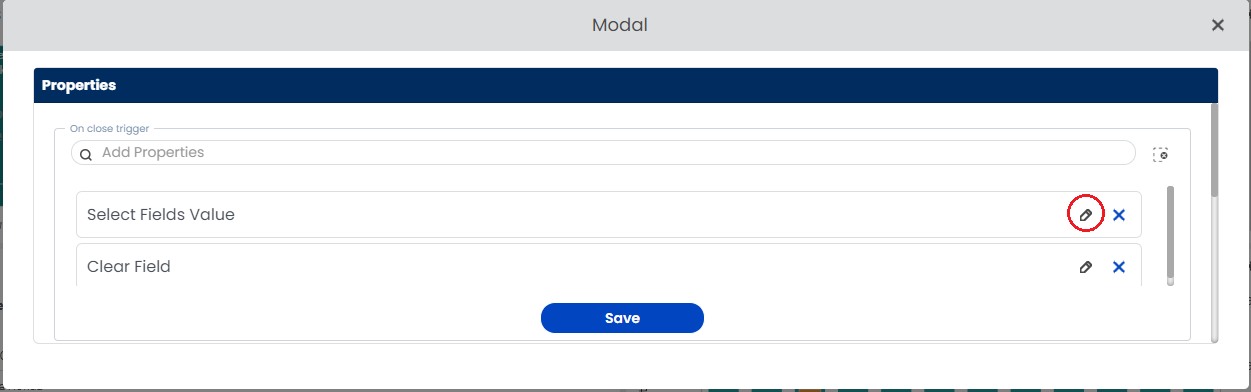
Now from the search bar, select the functions that is to be executed on close of the modal. User can select multiple functions.
Click on Edit icon on each function to write Qlik expressions and save it.
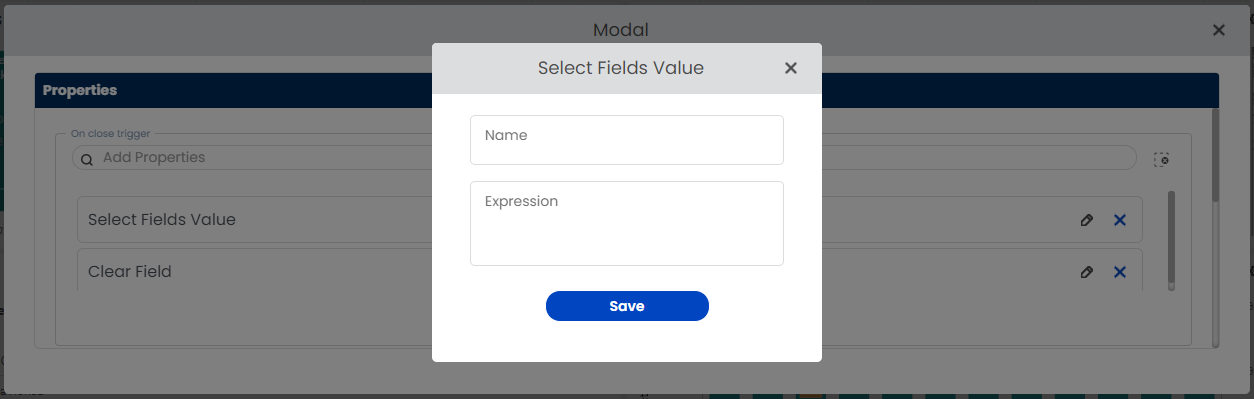
Now the modal is successfully configured with triggers.
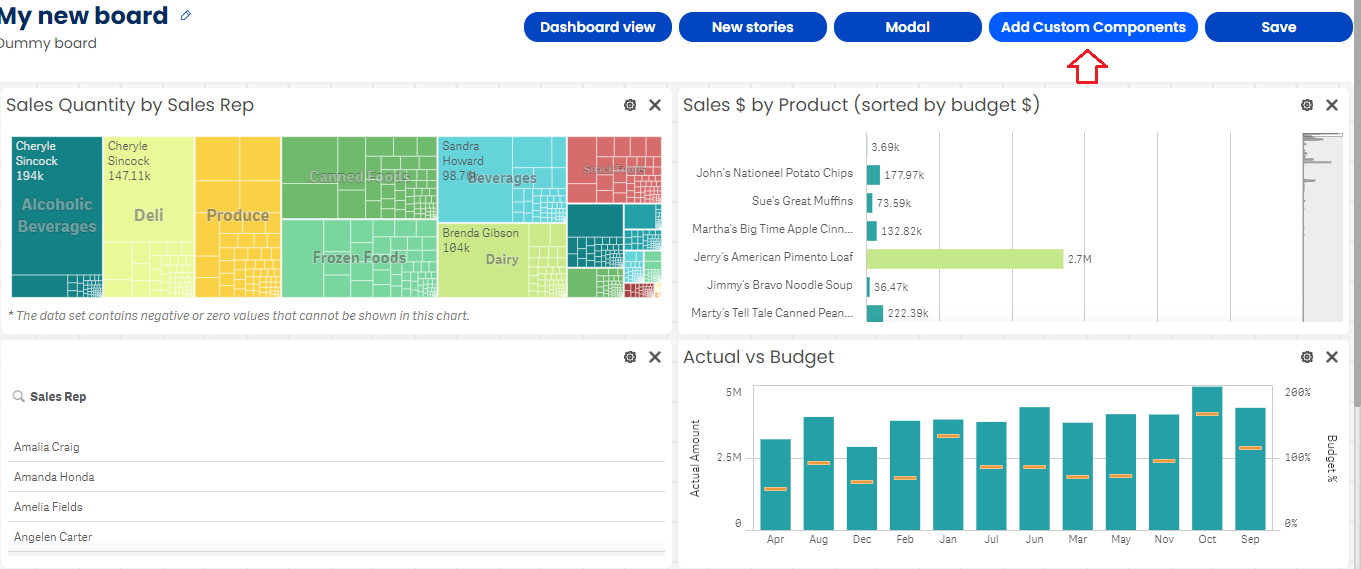
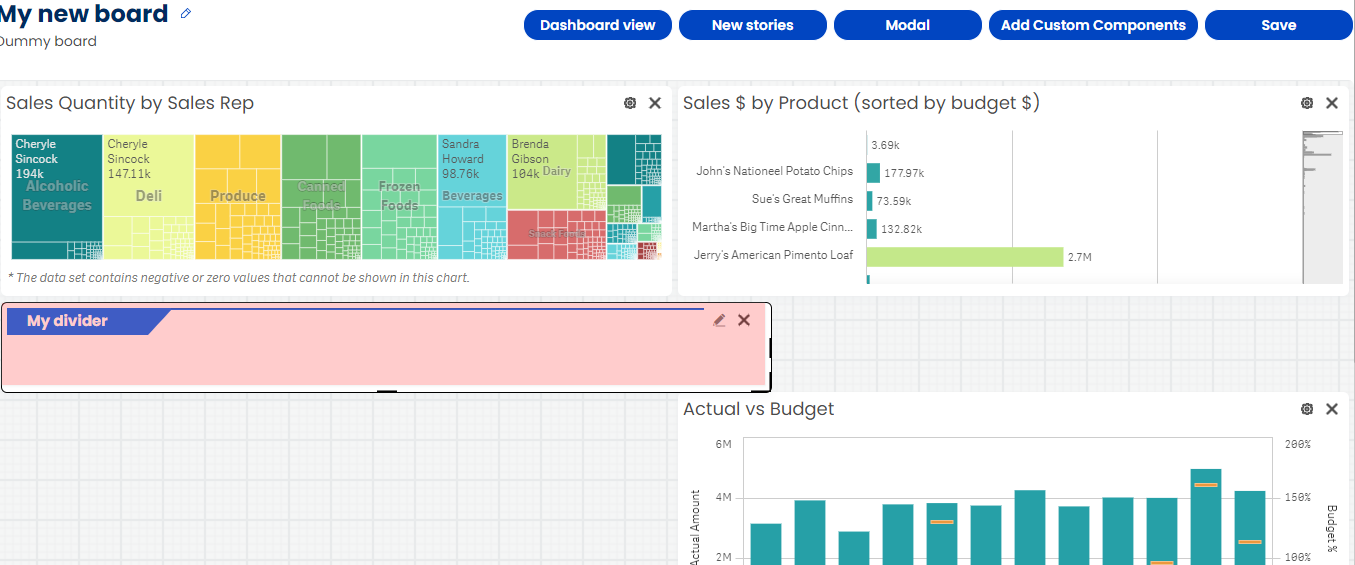
Adding custom components
SenseOps UI Builder allows it's users to add custom components like dividers, images, line & text to the boards. Users can do that by clicking on Add custom components button at the top and selecting the type of component from the modal.
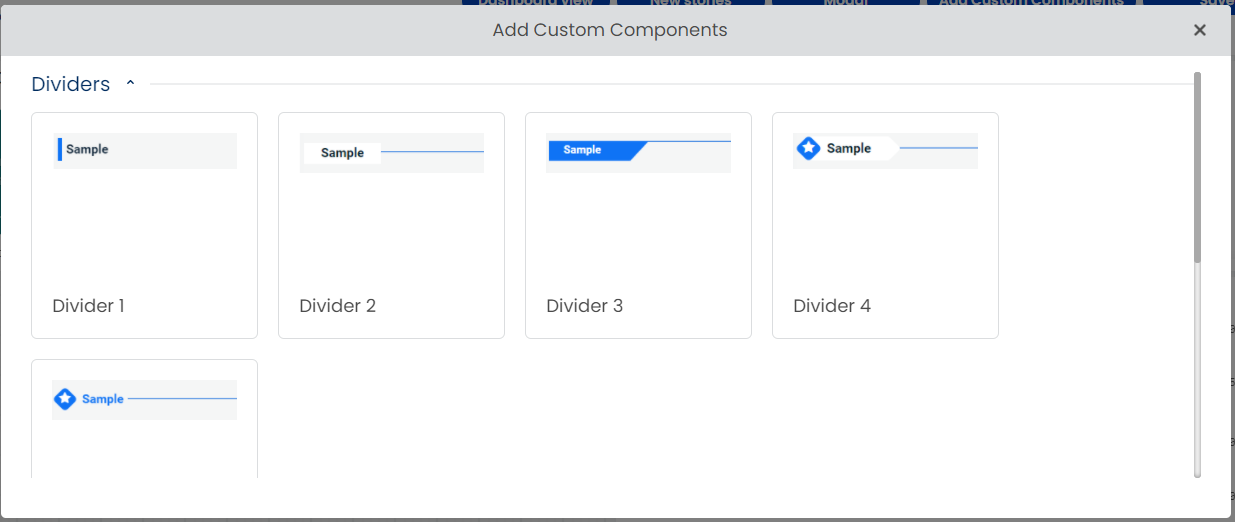
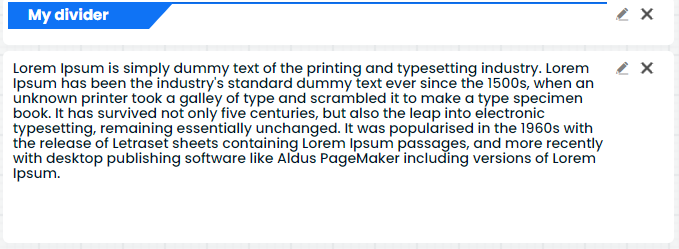
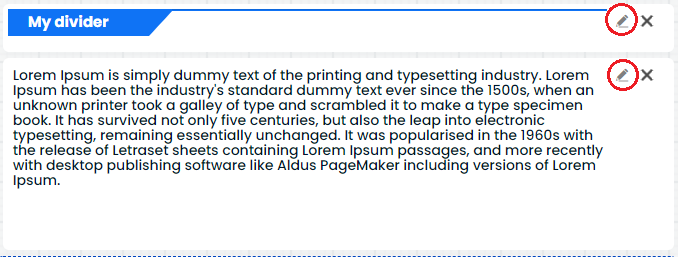
Dividers
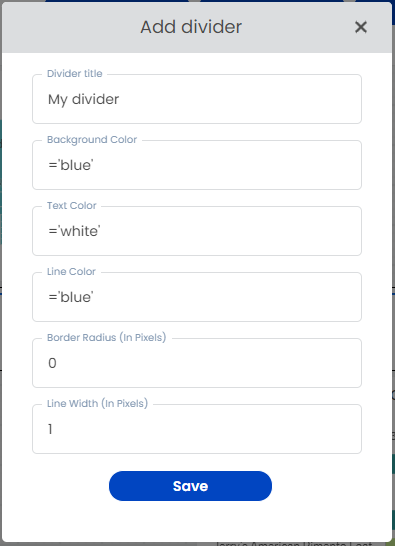
To add a divider, select any divider of your choice and a popup will be displayed. Add required details in the modal and save it
| Form input | Input type | Input example |
|---|---|---|
| Divider title | Text | My divider |
| Background color | Qlik expression | ='blue' |
| Text color | Qlik expression | ='white' |
| Line color | Qlik expression | ='blue' |
| Border radius | Number(in pixel) | 0 |
| Line width | Number(in pixel) | 1 |
Now adjust the divider as per your requirement using the resize handles.
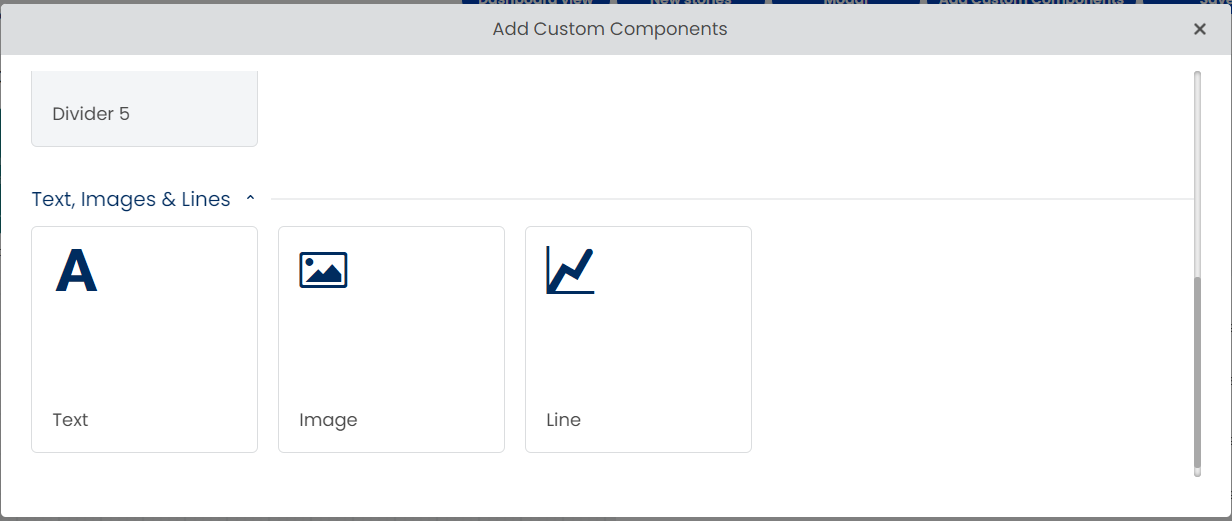
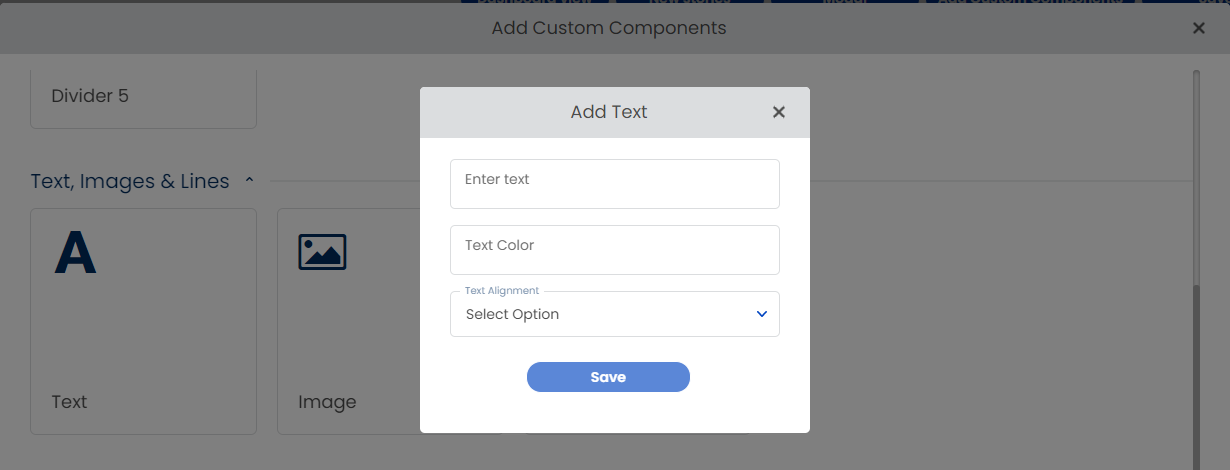
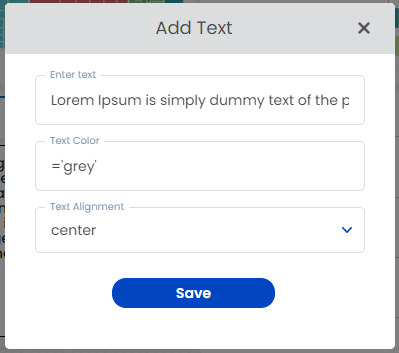
Text
Click on text component to configure and add text.
| Form input | Input type | Input example |
|---|---|---|
| Enter text | Text | Lorem ipsum is a dummy text |
| Text color | Qlik expression | ='blue' |
| Text alignment | Qlik expression | Left, right, center |
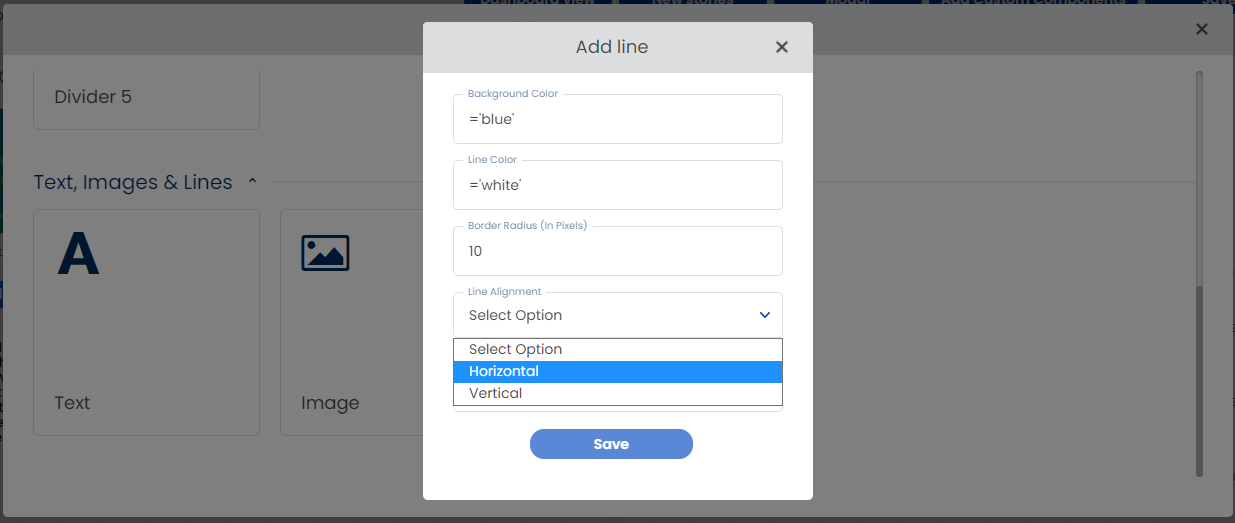
Line
Same as other components, a horizontle or vertical line can be created using custom components.
| Form input | Input type | Input example |
|---|---|---|
| Background color | Qlik expression | ='blue' |
| Line color | Qlik expression | ='white' |
| Border radius | Number(in pixel) | 0 |
| Line alignment | Dropdown | Horizontle, vertical |
| Line width | Number(in pixel) | 2 |
These custom components can also be edited using 'Edit' icon present at the top right corner of each component.
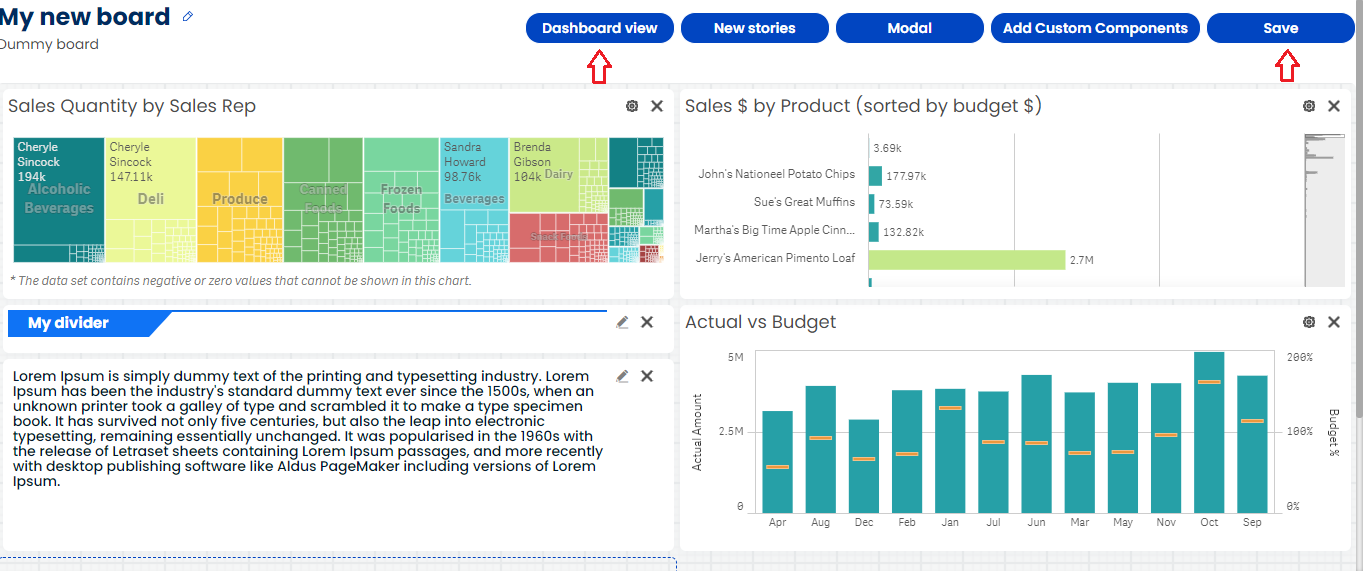
Save and Dashboard view
Users can click on Save button to save the changes they've done to their board and the same will reflect in the dashboard. Users can click on Dashboard view button to directly navigate to the dashboard.
Story specific settings
Create Toggle
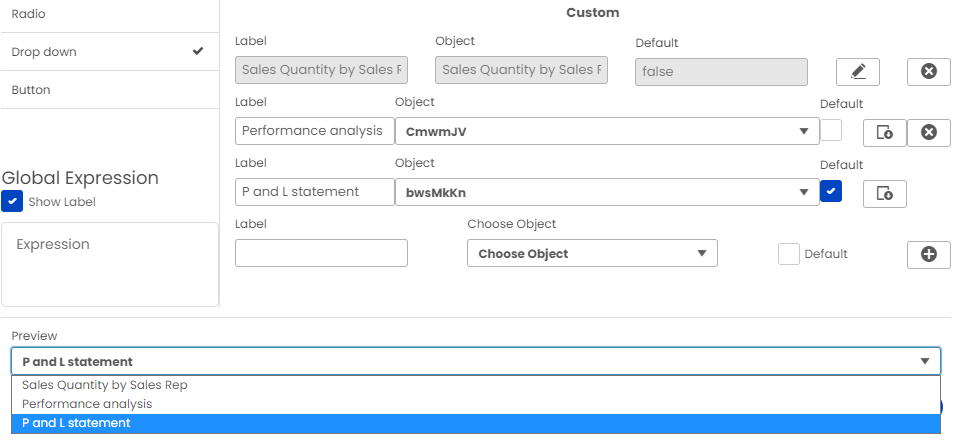
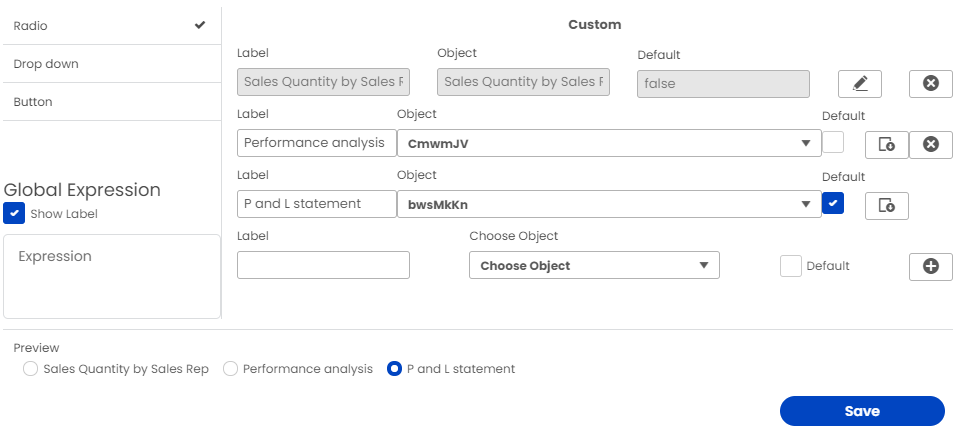
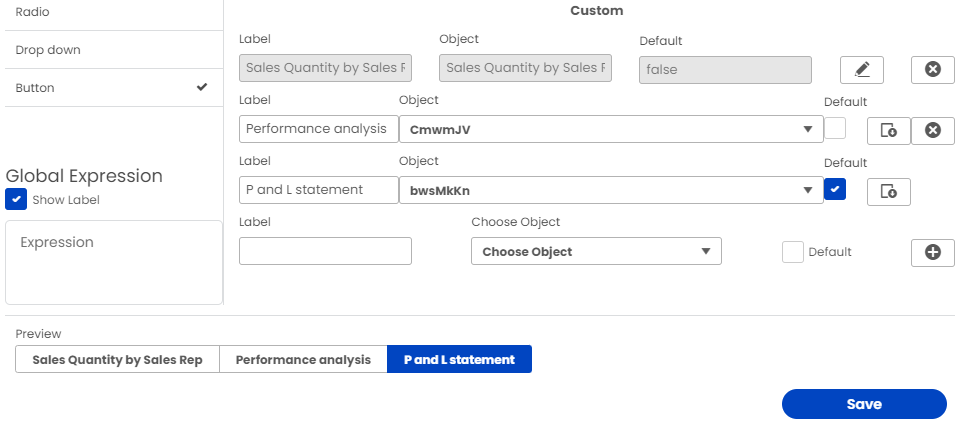
Users can switch between the charts from the dashboard using radio buttons or dropdowns or a simple button on the chart. Create toggle option allows user to configure this function
User can add multiple charts to toggle with using Add chart icon. User can also edit the default chart by clicking on the Edit icon and again lock it using lock icon. Created chart can also be deleted using Delete icon. Once a new chart is added, user can view the preview of it in the Preview section at the bottom of the modal.
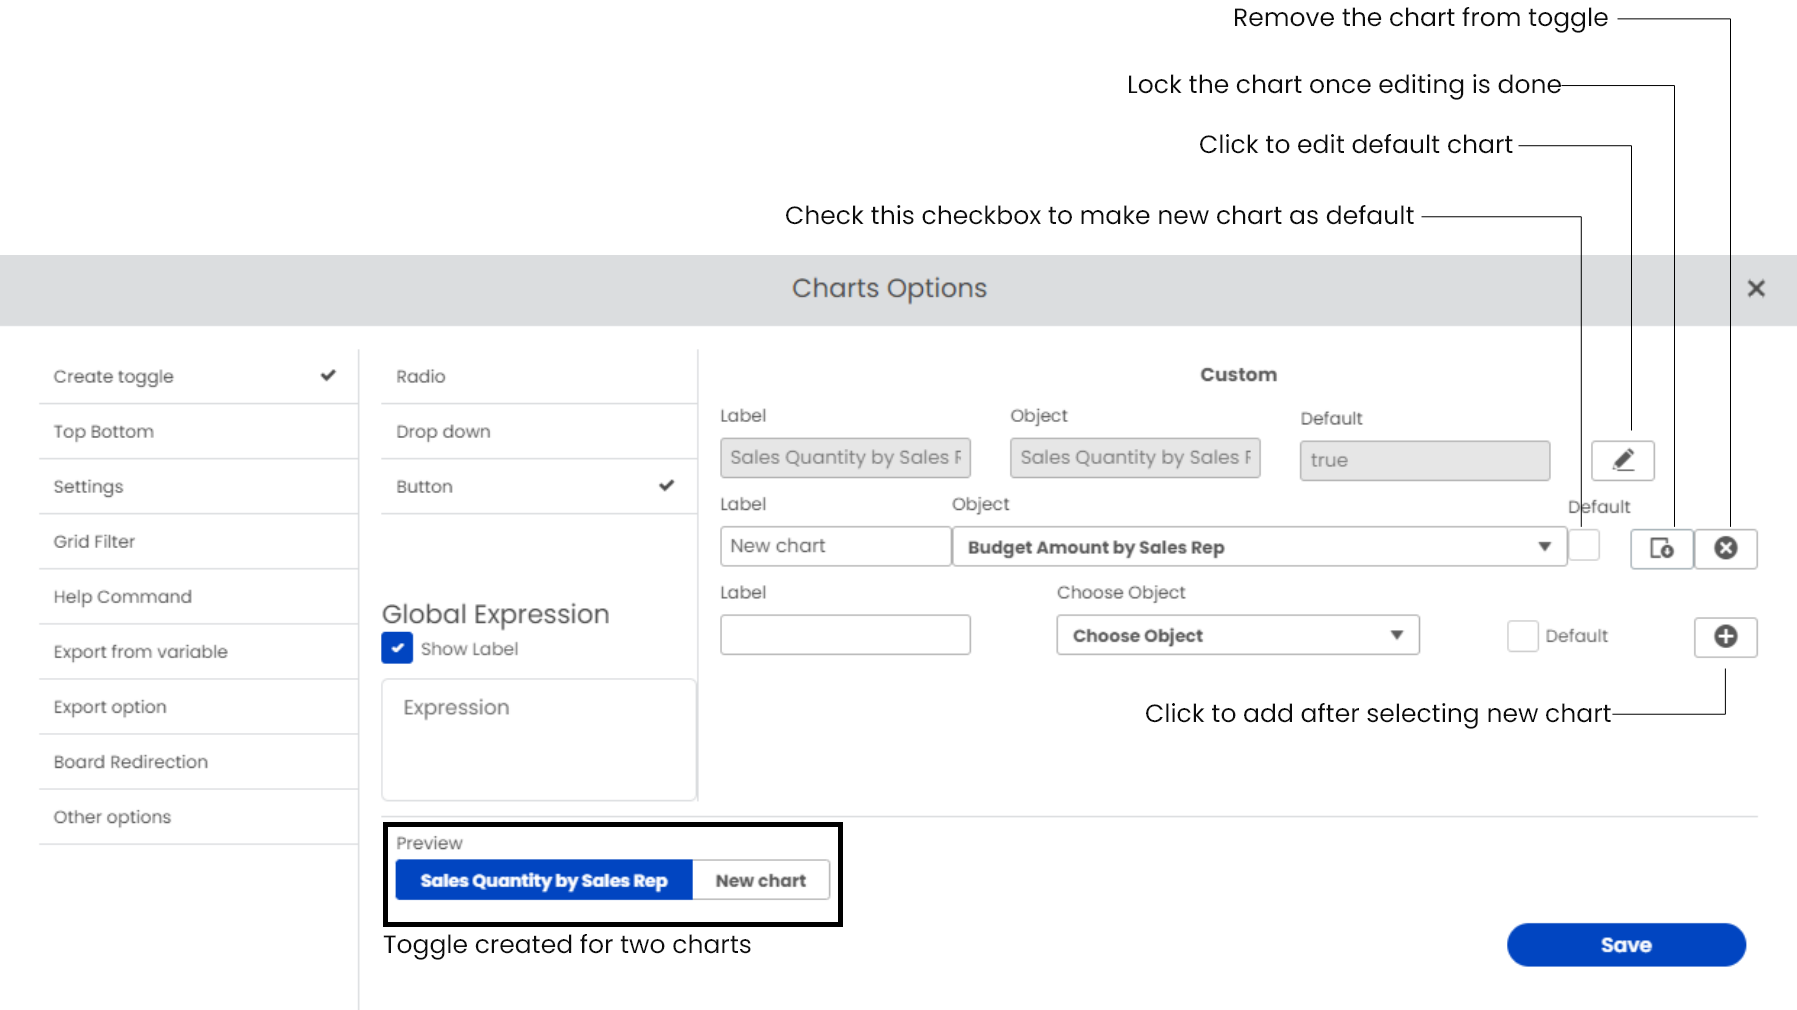
Users can decide which toggle object suits best for his/her chart from radio buttons, dropdowns, and buttons. Whatever the user chooses, it'll be reflected in the preview section. User can also display dynamic label using Global expression.
Top/Bottom
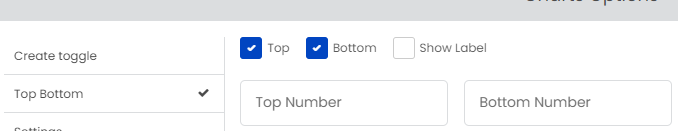
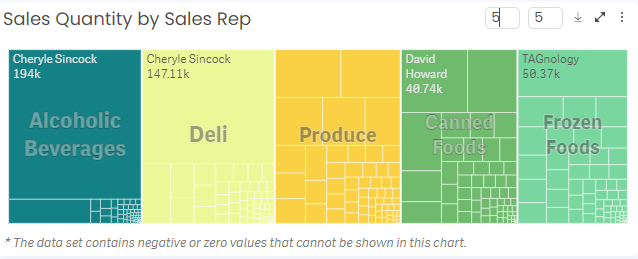
SenseOps UI Builder allows users to define the number of top values & number of bottom values to be displayed in the chart. Eg., Top 5 cities in the growth list or bottom 5 products which aren't doing well.
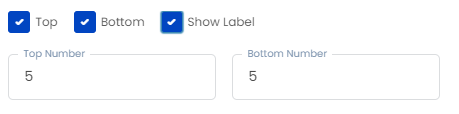
User can check the top or bottom boxes or both as per the need & input the desired value.
 The output will be as follows. The chart will have two input boxes each one for top and bottom. The data will be displayed as per the input.
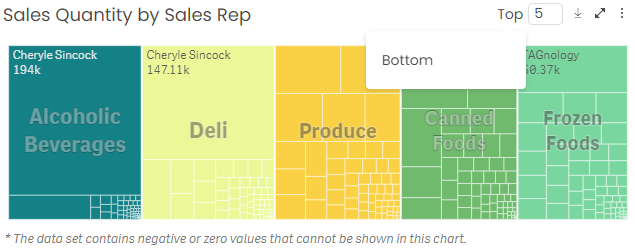
User will have one more option to toggle between top & bottom. It can be done by enabling the Showlabel checkbox.
On hovering Top label, a tooltip with the Bottom label will appear. By clicking it, the user can switch between top to bottom and vice versa.
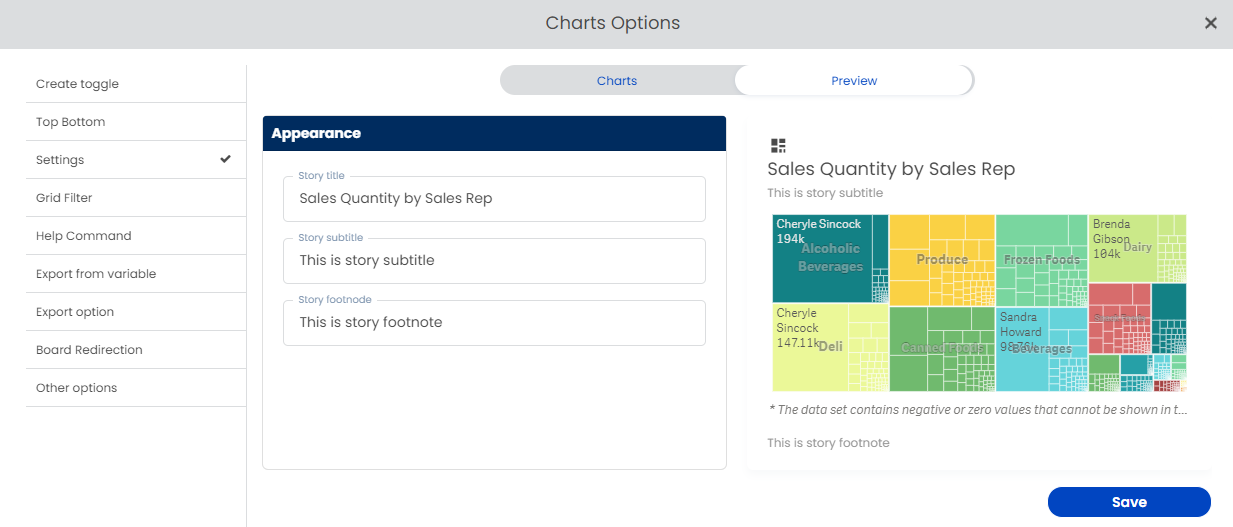
Setting
Using 'Settings' SenseOps UI Builder allows users to modify the size, metrics, and type of the chart. In the 'Chart' tab, the user will have a wide range of charts to choose from. In the same tab, users can enable disable existing dimensions & measures using their respective checkboxes.
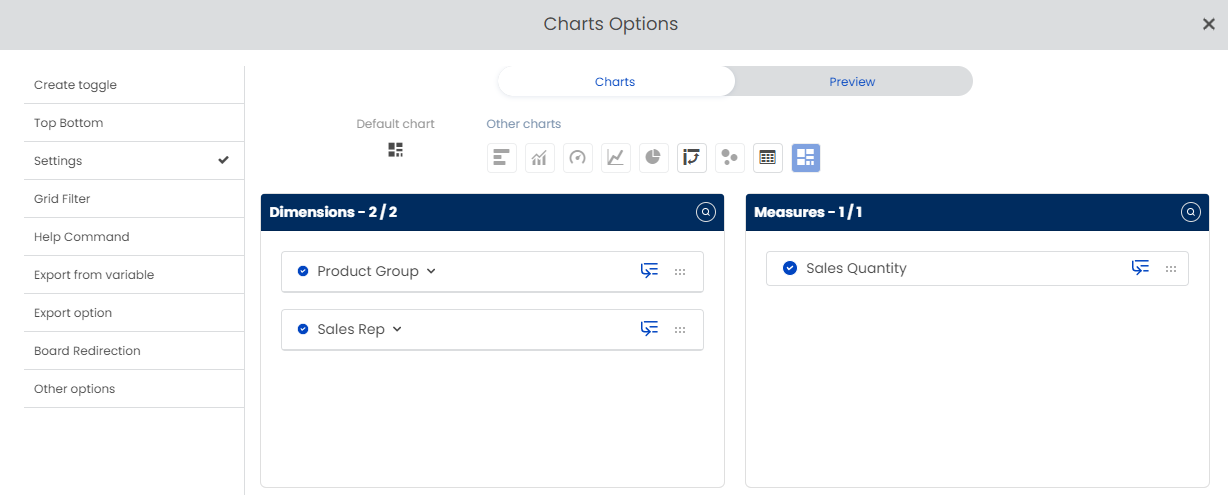
The chart settings which user made can be seen as a preview in Preview tab. In the Appearance section of the Preview tab, user can add story title, story subtitle & story footnote. If the chart settings are satisfactory, user can save it and changes will reflected in the dashboard.
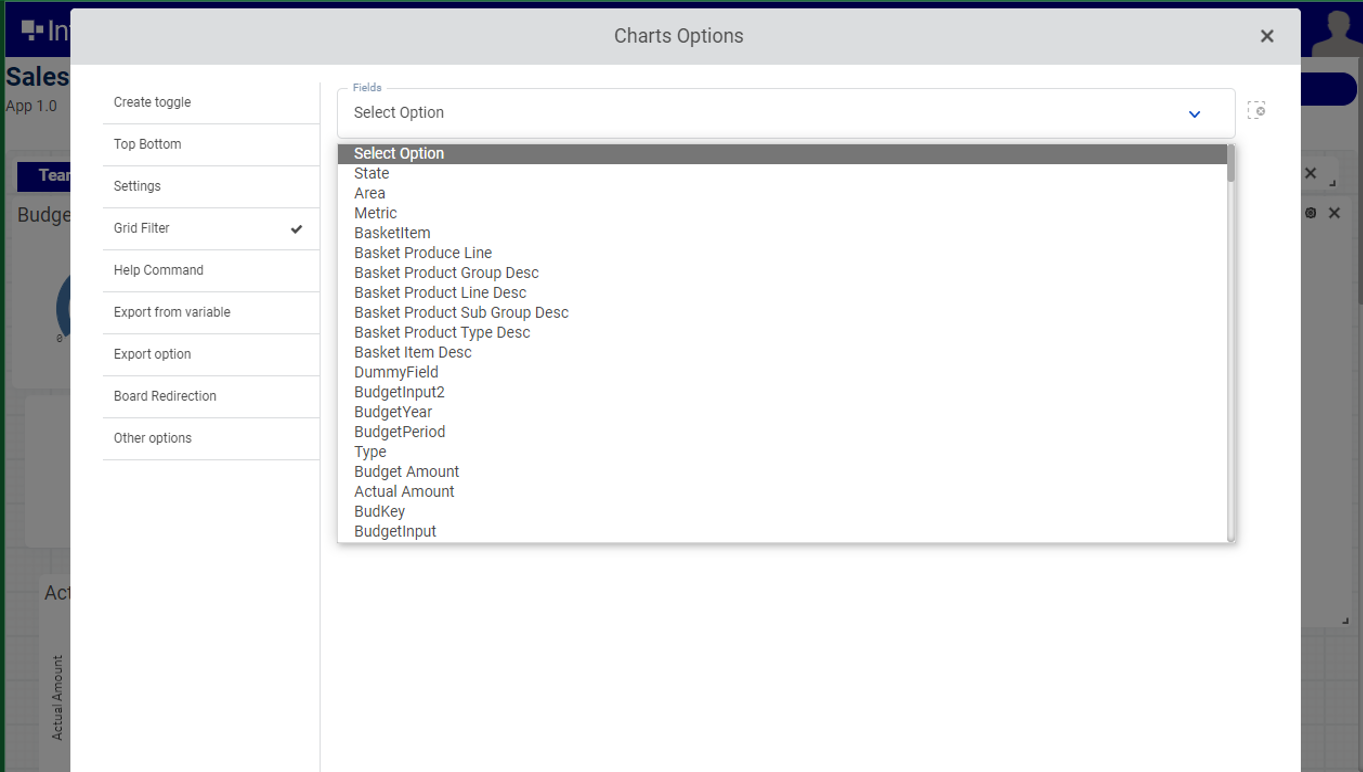
Grid Fillter
Users can add a filter inside a grid/chart for quick access. User can decide if it's going to be a button/radio button or a dropdown. For this user needs to select a field from the Field dropdown and type of the component from Type dropdown and save it.
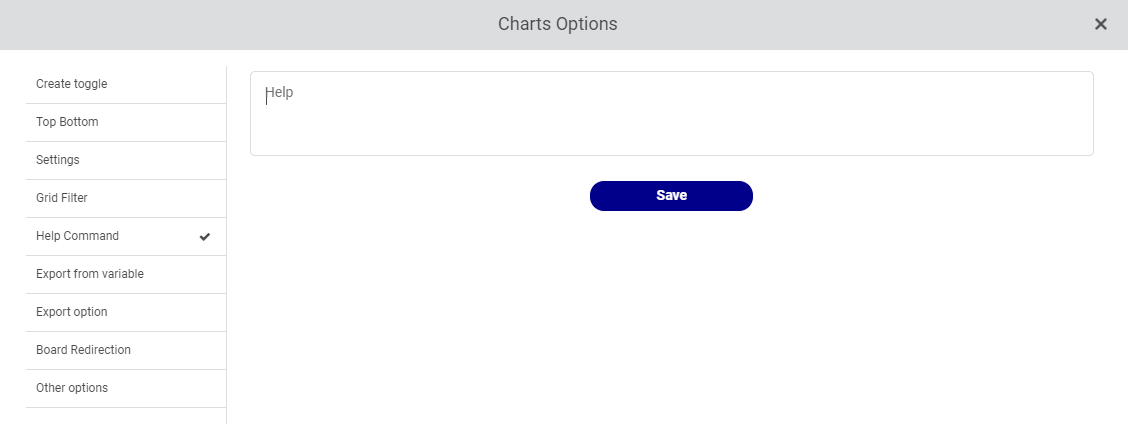
Help Command
Users can make comments to a specific chart using this option.
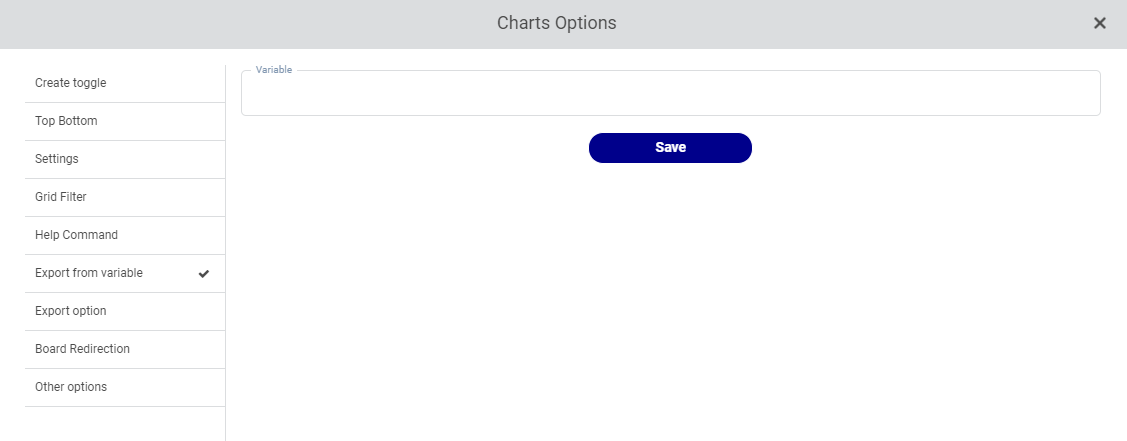
Export from variable
The user can export the chart from a qlik variable using this option.
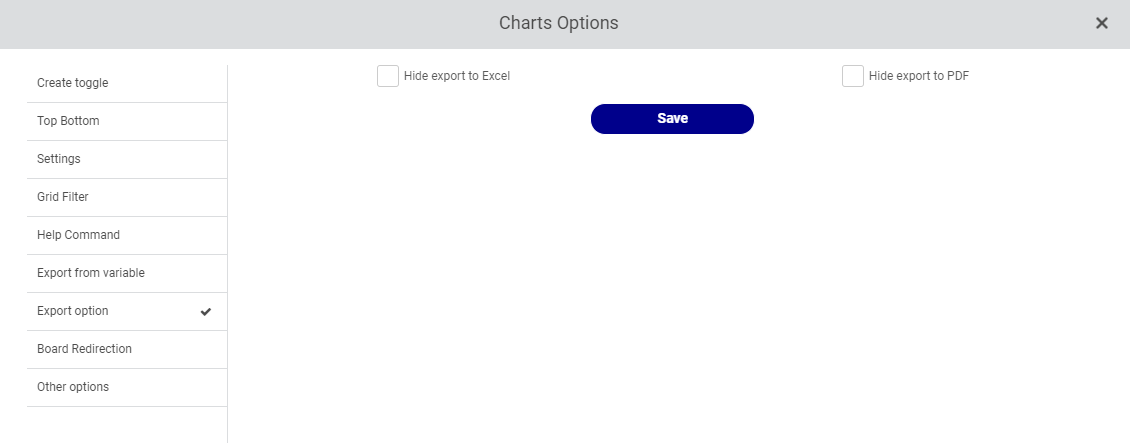
Export Option
There will be options to export to Excel and PDF in the export settings. The export option in the charts can be viewed based on the user's choosing.
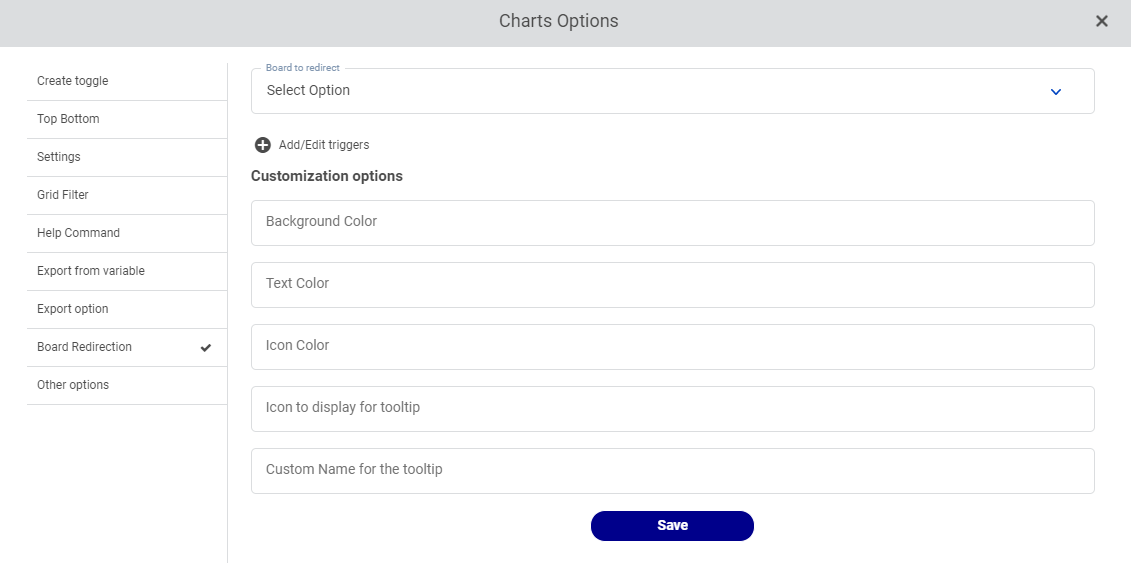
Board Redirection
Boards redirection will route you to a specific board depending on a qlik trigger, and the redirection may be adjusted using the options.
| Form input | Input type | Parameter | Parameter example |
|---|---|---|---|
| Board to redirect | Dropdown | List of all the available boards | New board |
| Background color | Qlik expression | nan | ='blue' |
| Text color | Qlik expression | nan | ='white' |
| Icon color | Qlik expression | nan | ='blue' |
| Icon to display for tooltip | Link/URL | nan | https://www.seekpng.com/ima/u2q8o0w7e6u2w7y3/ |
| Custom name for the tooltip | Text | nan | Navigate to new board |
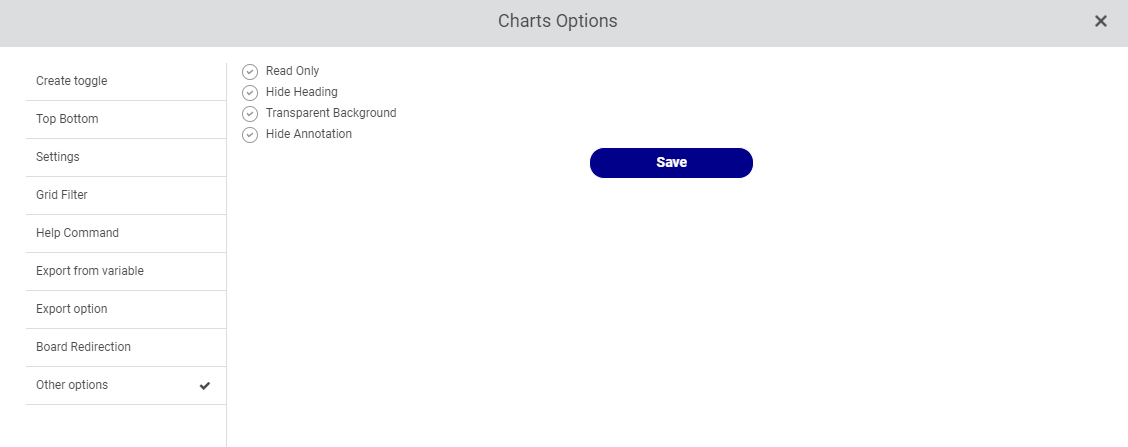
Other Additonal options
A below option can be offered in the settings for a certain chart.
| SNo | Chart option | Function |
|---|---|---|
| 1 | Read only | All the functions of the chart will be disabled. User cannot be able to perform any actions. |
| 2 | Hide heading | Hides the heading which includes chart title and all the other functions |
| 3 | Transparent background | The particular grid/chart will have transparent background instead of white. |
| 4 | Hide annotation | Hides the create annotation and view annotation options from the chart menu. |
Read Only
This option allows the user to simply look at the chart without performing any actions.
Hide Heading
The chart's heading can be concealed or exposed.
Transparent Background
Transparent Background Charts can have a transparent background.
Hide Annotation
Create annotations and view annotations can be concealed in a single article.
Creating custom stories
Apart from importing stories from Qlik Sense, SenseOps UI Builder permits it's users to create custom stories. To create custom stories go to Customize boards page and click on Stories tab. In the right hand side click on Add icon.
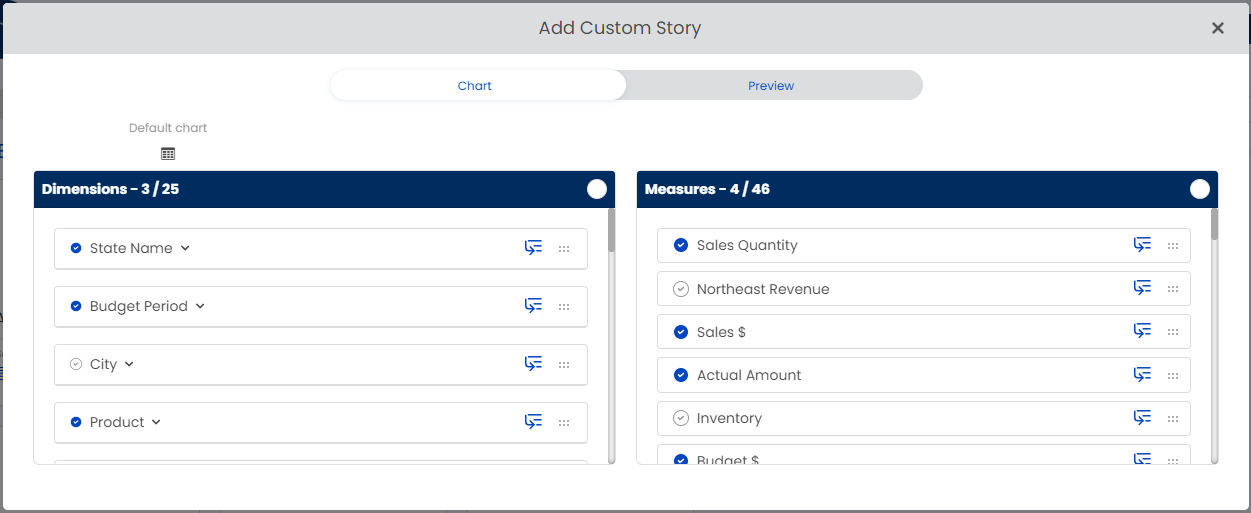
When Add button is clicked, Add custom story modal will open which will have a list of dimensions and measures for user to select.
After the selection of dimensions and measures, user can click on Preview tab to preview the custom story created. User can name the story as he/she requires and save it.
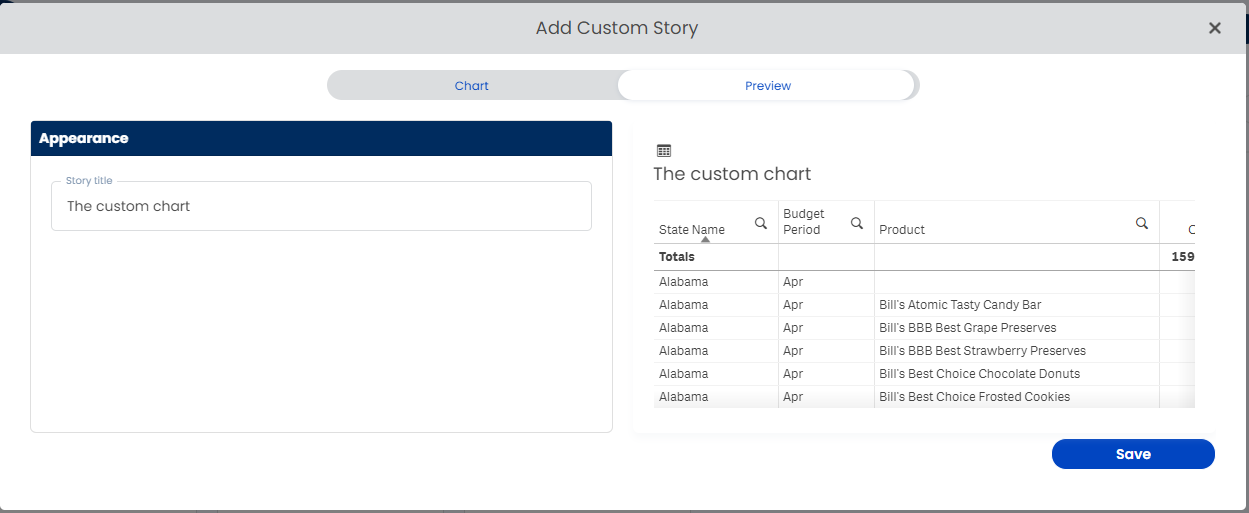
Newly created custom story will be now available for importing.