Embed Anywhere
Introduction
This document provides comprehensive information about Senseops Embed Anywhere for portal integration or Qlik mash-ups. Additionally, GIF graphics have been included to demonstrate the usage of Embed Anywhere on webpages.
*** Information on the Embed Anywhere. ***
About Embed Anywhere
Effortlessly integrate Qlik Sense objects into any webpage with just a few clicks. Gain complete control over the layout and presentation of your charts, providing users with an exceptional experience.
Installation of the Embed Anywhere
Follow the step-by-step instructions in the accompanying GIF video to easily install Embed Anywhere.
Features
Embedding Qlik objects in the web page
- Click on the Page inspect Icon present in the right side of the screen as shown in the below figure and click on the any object that you wanted to replace.
- Once we click on the object in the web page Grid settings Popup will open. There we have three sections.
- After that we have to select the application in the data selection section dropdown after that we have to select the object from the Select Chart dropdown
- Then if you want to customize the chart then expand the Chart styles section there we have Chart background color for changing the background color of the chart and Chart padding for adjusting of the chart if you not add any thing default styles will apply from the Global Settings
- Once we setted color and padding of the chart if want we can change the chart settings for that we have Chart settings section there we can set the chart Readonly, Export to Excel, Maximization, and Hide header options
- And Finally click on the Save button once you Click on the save button the qlik object will Embed in your web page if you not add any thing default styles will apply from the Global Settings
Editing Qlik objects in the web page
- Clik on the View list Icon on the right side of the screen, as shown in the figure below. Click on it, then select the Edit Icon on the right side of the object list.
- This will open the Grid settings Popup.
- Make the desired changes in the Grid settings Popup according to your preferences.
- Once you have made the necessary changes, click on the Update button. This action will apply the changes to the embedded qlik object on the web page.
Embedding KPIs in the web page
-
click on the Page inspect icon on the right side of the screen. Refer to the figure below for visual guidance. Once clicked, choose the desired label object that you wish to replace.
-
When you click on the object in the web page, a popup titled Grid settings will appear. This popup is divided into three sections. Select the "KPI" section from these options.
-
In the data selection section, choose the desired application from the dropdown menu. Afterward, select one option from the Measure, Variable, and Expression radio buttons.
-
Based on your selections, the dropdown menu will fetch and store the relevant qlik objects.
-
Next, click on the dropdown menu and select a specific KPI object from the provided list. If you wish to modify the number format, utilize the Number Format section and make the necessary changes.
-
Additionally, if you want to include any actions for the KPIs, such as Clear All Sections you can add them in the KPI Actions section.
-
Finally, click on the Save button. Upon clicking this button, the qlik KPI will be embedded into your web page.
Adding Actions
- Click on the Page inspect Icon present in the right side of the screen as shown in the below figure and click on the any object that you wanted to add the Actions while clicking on it.
- Once we click on the object in the web page Grid settings Popup will open. There we have three sections.select the Actions tab
- After that we have to select the application and click on it
- After that click on the Add Action button it will open the actions dropdown with default ApplyBookmark
- And click and open the dropdown you will list of the action you can select what action you want
- And Finally click on the Save button once you Click on the save button the action will Embed in your web page.
Deleting Embedding objects in the web page
- Clik on the View list Icon on the right side of the screen, as shown in the figure below. Click on it, then select the Delete Icon on the right side of the object list.
- This will remove the object from the page
Properties
Grid settings
Once the user has selected a location and clicked where to embed the qilk object, the Grid Settings Popup page will appear.In Grid settings we have five tabs there are
Chart
In the Chart tab again we have Data Selection ,Chart Styles, and Chart Settings sections as shown in the below figure.
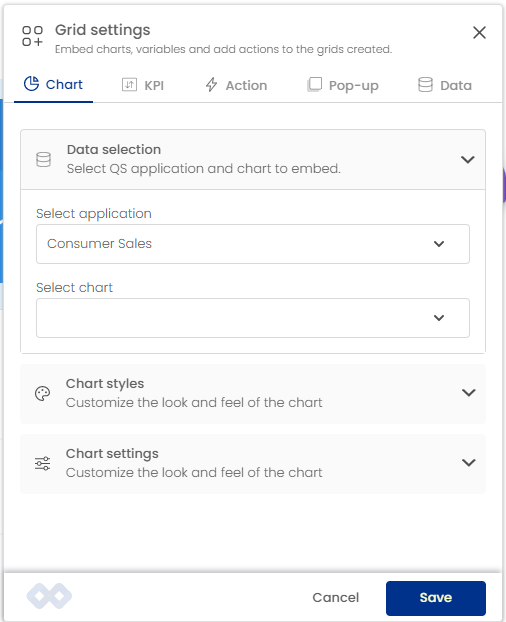
- Data Selection: To embed objects from your Qlik Sense applications by selecting the desired application from the Select Application dropdown in the Data Selection section. Once the application has been selected, users can browse through all available objects from the Chart Selection dropdown list and select the one they wish to embed with ease.
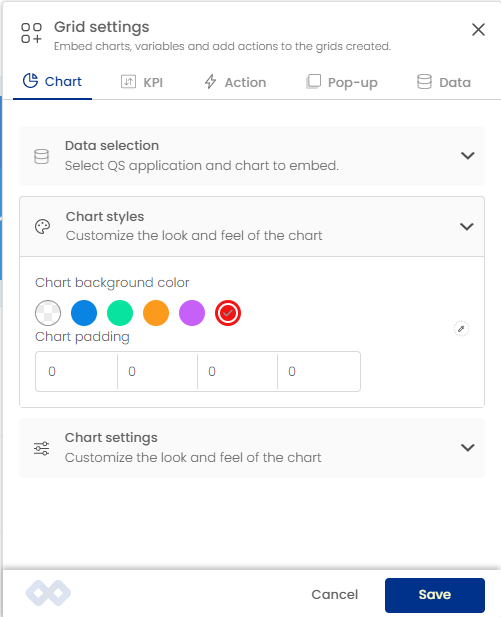
- Chart Styles: To customize the appearance of a chart, users can utilize the Chart Styles section. This feature includes options for changing the chart's background color and adjusting the chart padding.
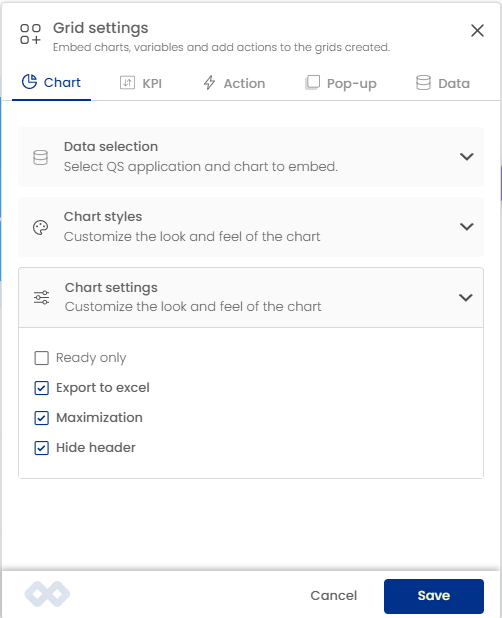
- Chart Settings: To modify the properties of a chart, users can access the Chart Settings feature. This section provides users with the ability to easily enable and disable various properties like ReadOnly, Export to Excel, Maximization, and Hide header of the chart to better meet their specific needs.
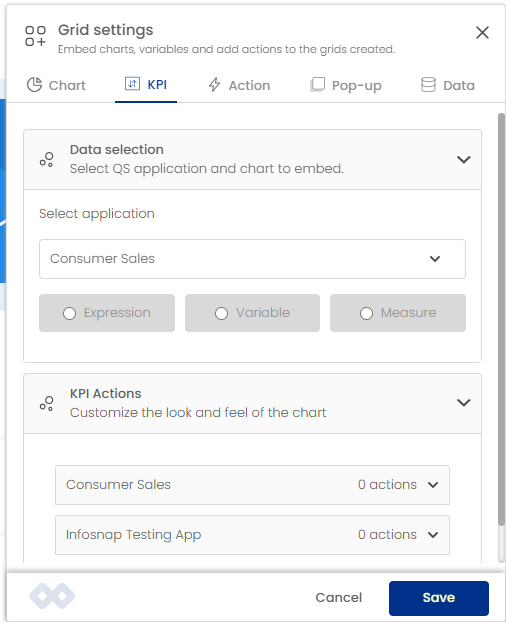
KPI
In the KPI tab again we have Data Selection, and KPI Actions sections as shown in the below figure.
-
Data Selection: To embed KPI objects from your Qlik Sense applications by selecting the desired application from the Select Application dropdown in the Data Selection section.After selecting an application, users can choose to add either an Expression, Variable, or Measure to their project, depending on their specific needs.
-
KPI Actions: To add KPI actions for KPI objects, users can utilize the KPI Actions section. This feature provides an easy way to assign actions to KPI objects, allowing users to quickly and efficiently interact with data and gain valuable insights.
Action
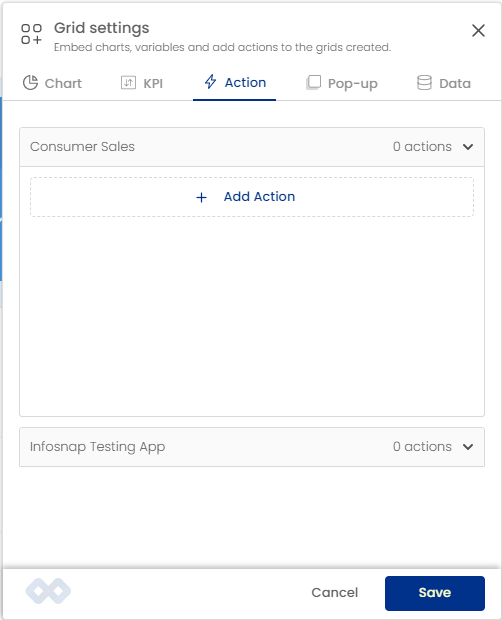
- Action feature allows users to easily add various actions while doing the mouse click such as Clear All Selections and Apply Bookmarks etc, to their project, providing users with enhanced interactivity and greater control over their data
Pop-up
Coming up soon
Data
Coming up soon
Embed list
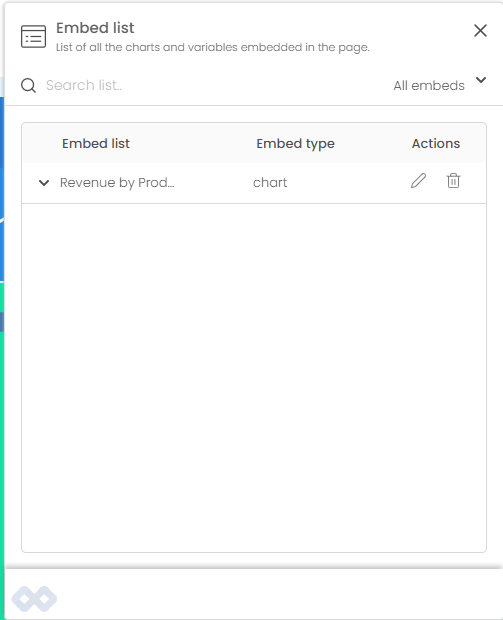
- Embed List screen displays a comprehensive list of all objects that have been added to the webpage. From this screen, users can easily delete or edit any objects, providing them with complete control over their embedded content.
Global settings
- Global Settings feature allows users to apply settings globally to their embedded content. This includes three segments: Chart Settings, Loader Settings, and Qlik Sense Theme. With this feature, users can easily make consistent changes to their embedded content.

- Chart Settings feature is mainly focused on the appearance of the object, allowing users to customize settings such as background color, chart padding, read-only mode, chart export, maximization, and header visibility. These settings provide users with complete control over the look and feel of their embedded objects, ensuring a professional and visually appealing presentation.
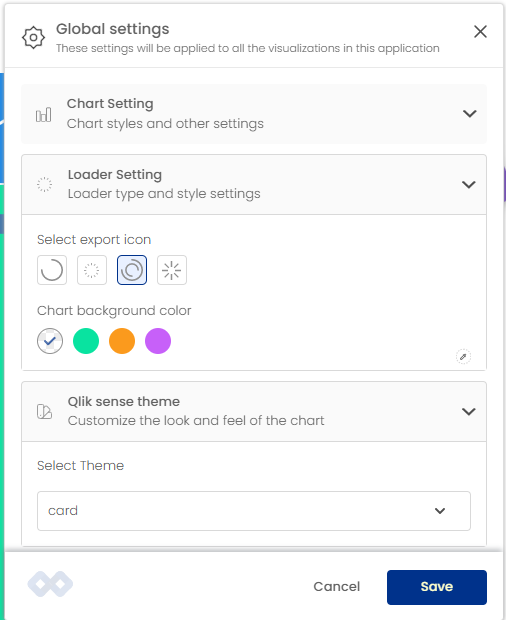
-
Loader Settings feature is primarily focused on the appearance of the object loading symbol and chart background colors. With this feature, users can customize loading indicators, providing users with visual feedback on the status of the embedded objects.
-
Qlik Sense Theme dropdown allows users to set themes for Qlik Sense objects that are embedded in their webpage.