Adhoc
Adhoc Report
Adhoc Report connects the user with the developer. Custom tables can be created using data from master tables, and super users can quickly form a clear, adaptable template. Users can then add and remove data from the table, as well as move and rearrange columns.
Introduction
This docmentation helps you get started with Adhoc Report and explains where to find the information you need.
Setting up Adhoc Report
Follow the step-by-step instructions in the accompanying GIF video to easily set up the Adhoc Report.
Properties
Setting Data mode:
We have two options for adding DataSets to Adhoc reports: Master Object and Custom. By following these methods, the user can add the dataset mode.
- Open the Adhoc Report sheet and go into Edit mode.
- Select the the template in the sheet then user will able to see the properties pannel in the first property is the Dataset click on that after that user able to see the Data Set Mode dropdown and Tag List textbox as shown in the figure.
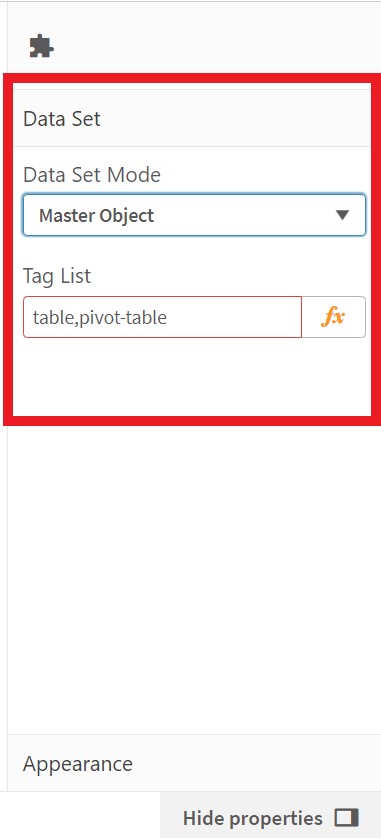
- If the Master Object is selected in the Data Set Mode User need to give the type of the master Viualization like showing in the above figure.
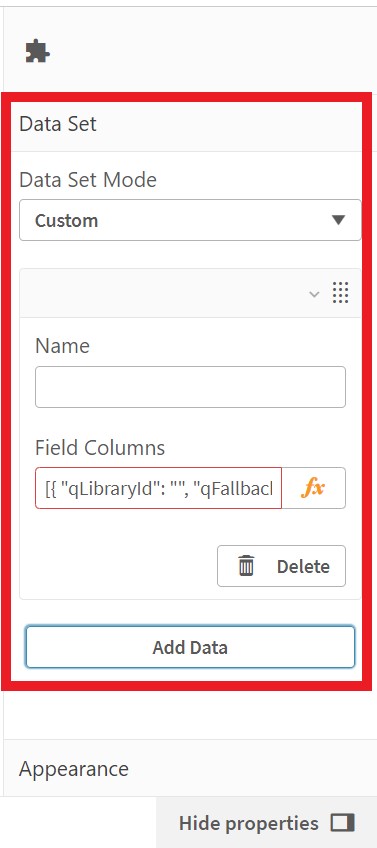
- If the Custom is selected in the Data Set Mode User need to add the data fileld manually what he needs like showing in the above figure.
Visualizations Settings:
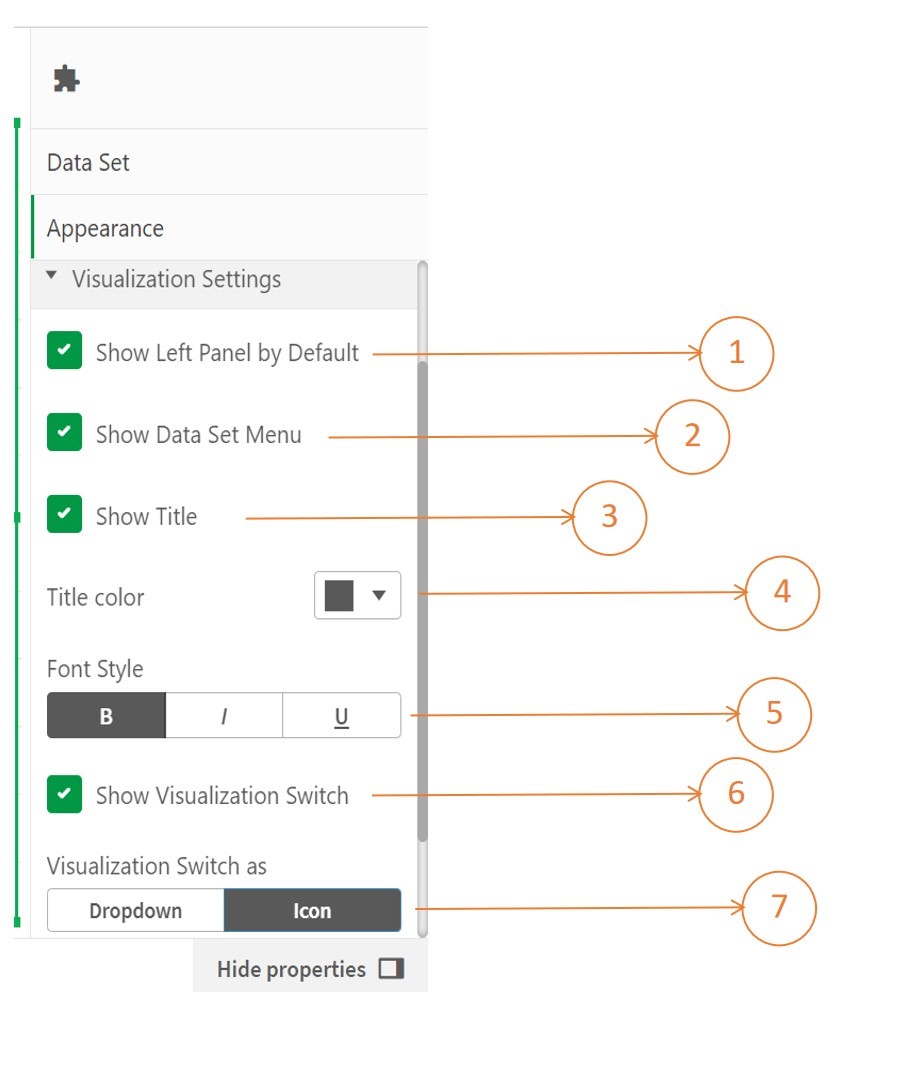
If Needs to change the Appearance of the Report, go to Edit mode and click on the Visualizations Settings under the Appearance section below screen will appear.
-
Show Left Panel by Default: If this option is selected during sheet loading or opening, the left panel will be in 'expanded' mode.
-
Show Data Set Menu: If need to show or hide the Data set menu in the Template this control will help.
-
Show Title: If need to show or hide the Title what the Data set is selected in the report this control will help.
-
Title Color: This control is will enables once the Show Title is selected. By using this control we can set the Data set title in the Report.
-
Font Style: This control also enables once the Show Title is selected. By using this control we can set the font style.
-
Show Visualization Switch: This control will helps to show or hide the visualization switch in the report.
-
Visualization Switch as: This control will enables once Show Visualization Switch is selected. By this control we can change the switch type to dropdown or Icon.
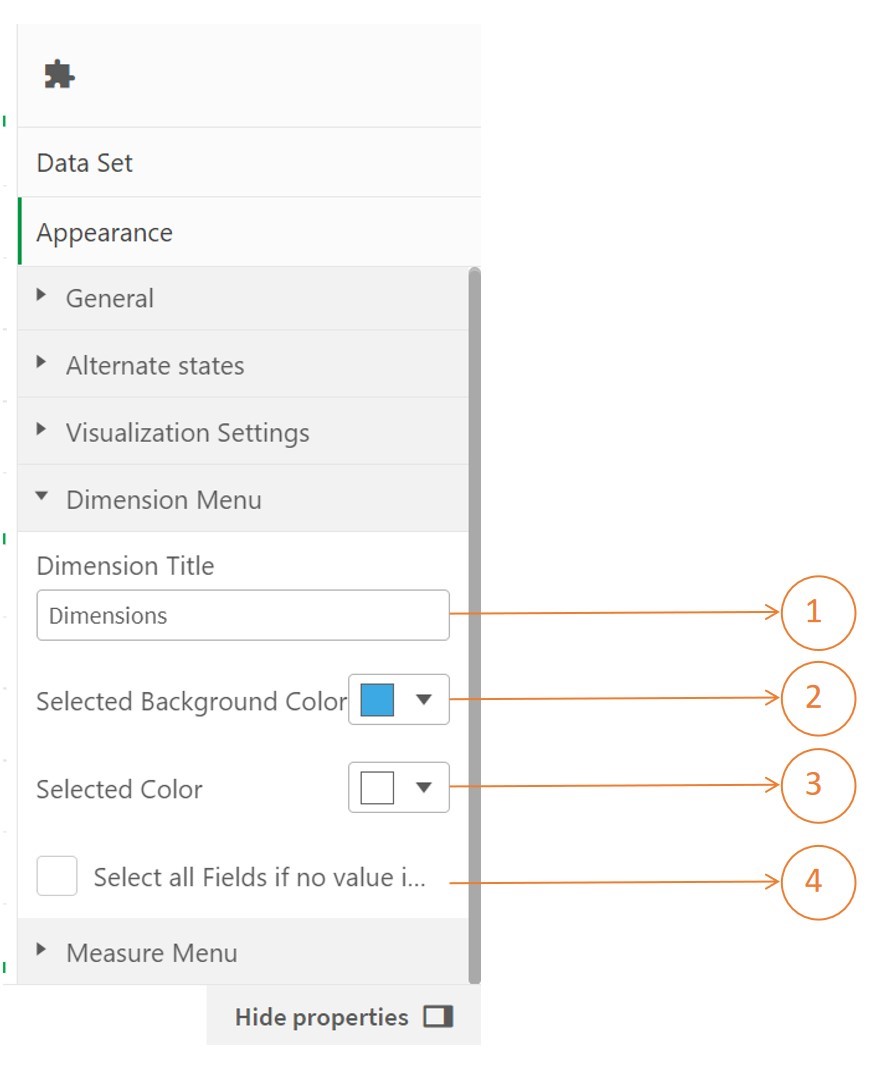
If Needs to customized the Appearance of the columns in the Report go to Edit mode and click on the Appearance under that Dimension Menu and Measure Menu section is used.
Dimension Menu:
-
Dimension Title: This control is used to change the title of the Dimension list.
-
Selected Background Color: This control will give to color to selected list of dimensions background color
-
Selected Color: This control is used to customized the color of the text in the selected dimension list.
-
Select all Fields if no values is selected: The control will function properly if we change the dataset, as all the dimensions of the next dataset in the list will be selected by default.
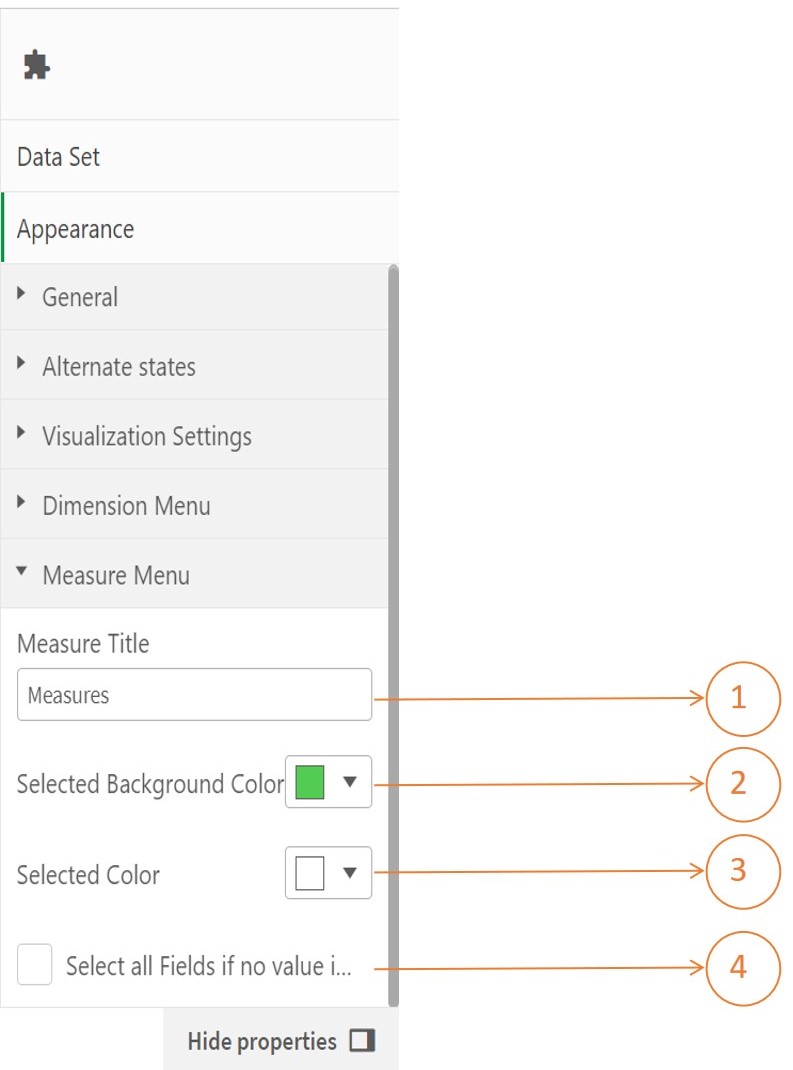
Measure Menu:
-
Measure Title: This control is used to change the title of the Measure list.
-
Selected Background Color: This control will give to color to selected list of Measure background color
-
Selected Color: This control is used to customized the color of the text in the selected Measure list.
-
Select all Fields if no values is selected: The control will function properly if we change the dataset, as all the Measure of the next dataset in the list will be selected by default.
Sorting Dimensions and Measures:
With the sort bar we can change the order of the dimensions and measures as show in below Figure
Example
The below video will demonstrate how to generate custom tables from a data set.There are two kinds of custom table generations: straight table and pivot table.