Resources
Blogs
Recap: Top features in 2023
Recap: Top features
in 2023
Posted on February 2, 2024 | By Admin
2023 was a delightful wrap for what we shipped from SenseOps! Where use of data and analytics platforms and dashboards is almost ubiquitous, there’s always the need to improve the experience for customers and more so, in a manner of creating direct impact.
Moving in this direction, last year’s key features across products viz., App Extensions, Custom Integrations and Code management added to the delight of Qlik Sense teams in more than one way. Let’s look at some unique features that added more power to users:
1. Alerting – Access based notifications for internal and external users

SenseOps Alerting delivers to the in-the-moment needs of analytics and business users navigating multiple applications, looking to keep pace with data that really matters. This in-app extension allows users to set custom rules to monitor specific measures, visuals or variables within their application, including filters and bookmarks included.
Alerting makes it possible for both internal and external users (customers, suppliers or partners) to stay informed as and when critical changes occur. Qlik teams can define reports based on chosen dimensions and selections, review their data rules – and importantly, maintain the integrity of data when shared across user groups.
2. UI Builder – Collation of data from multiple Qlik Sense apps

Another milestone release is in embedding with SenseOps UI Builder, a no-code user experience platform designed for Qlik Sense developers to accelerate mashup pages and fully govern page experiences when integrating Qlik dashboards on external pages. A key feature within the UI Builder release is the ability to instantly collate data from multiple Qlik Sense apps to curate or “Build Your Own Views”- in a matter of minutes .
Imagine having to bring customer or product information into an existing sales dashboard and create a branded experience for your customers, but with custom filters or views. The whole process needs design sensibilities and coding skills to come together.
UI builder unmasks the complexity behind this in 3 simple steps with a do-it-yourself experience, allowing you to:
- Instantly pull up Qlik Objects from across applications and organize them
- Control all aspects including the page layout, page structure, navigation, page elements (filters, headers, banners…), actions and over every Object
- Instantly collaborate with peers with annotations and sharing
The use cases of UI builder are many-fold and can prevent users from running into blind spots. Embedding teams can jumpstart integration journeys without the need to code or the struggle to main them, all of which impact customer experiences.
3. Pixel Perfect Reporting
The Pixel Reporting Extension allows users to build and share pixel-perfect reports for custom needs or reporting standards in practice. Users can create an ensemble of charts, variable KPIs and custom elements including snapshots, shapes, text, web page components, logos or more within layouts of their choice and share them over.
4. Smart Table Advanced tooltips
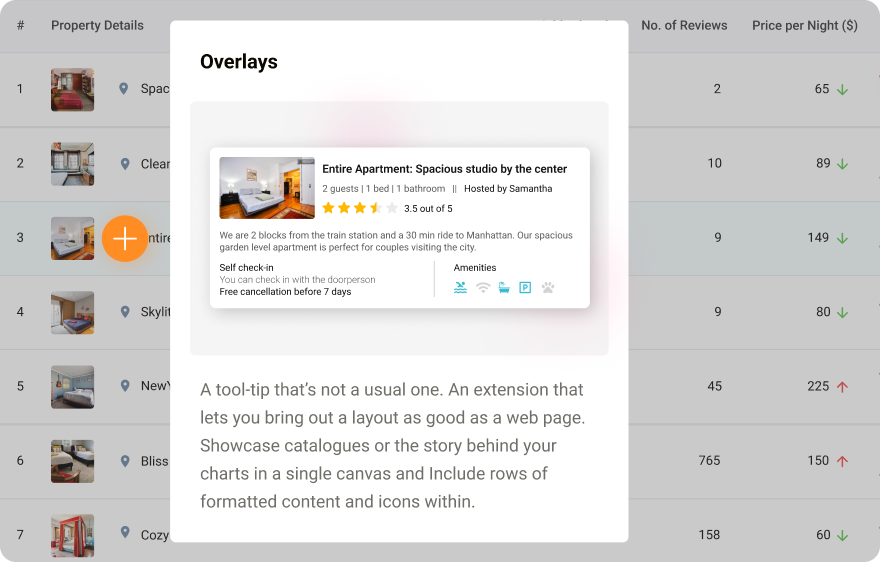
SenseOps Smart Tables is yet another extension to push boundaries in native Qlik tables and convey powerful stories with data. Users can pack more power within each column or cell with configurable mini-charts, conditional formatting, dynamic URLs, thumbnail images, icons and more. Furthermore, advanced tool-tips or overlays offer the flexibility to control media elements, container views and the complete styling – enabling a more modern, refreshing look with additional data for analysis. Smart Tables can help in conveying powerful narratives with your table data or in showcasing a catalogue or in simple tables where interactions are high.