Decode data in
newer ways
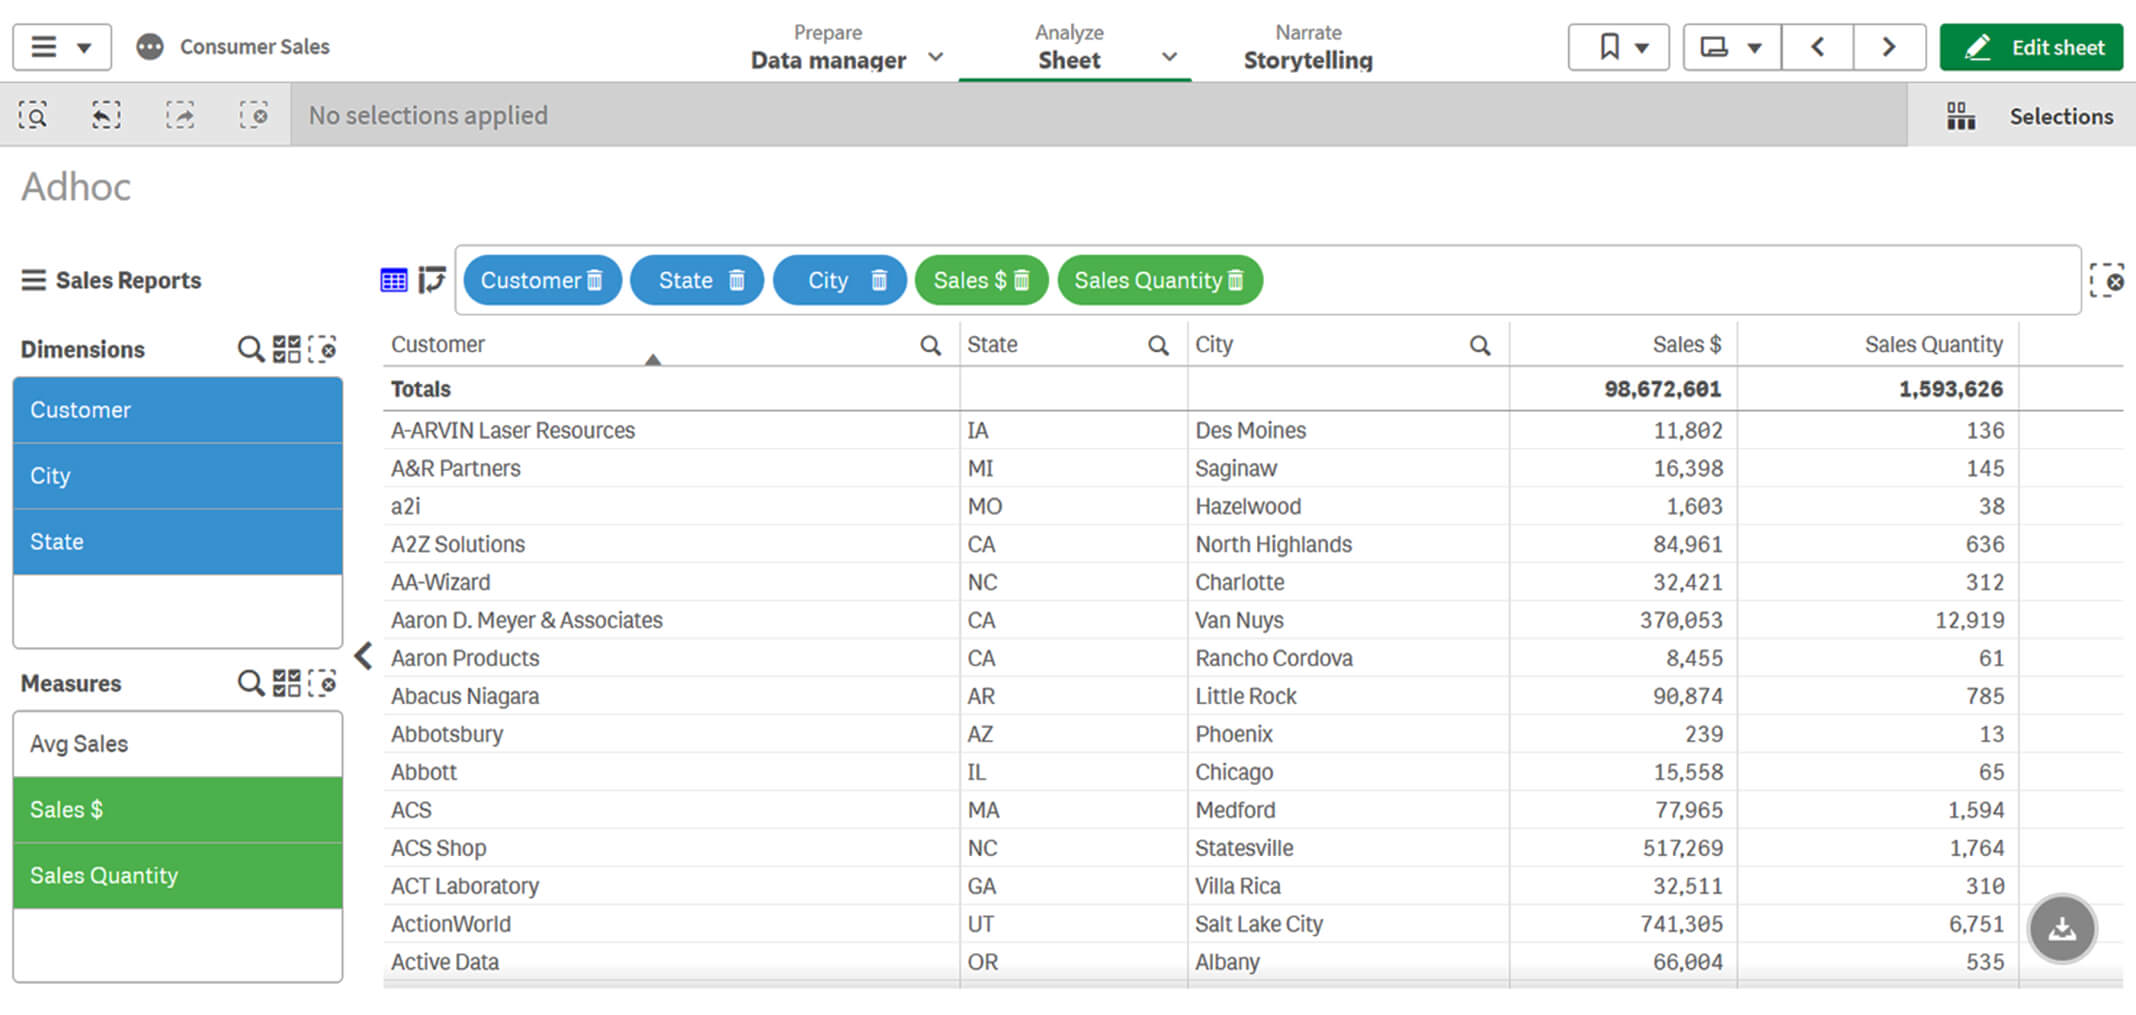
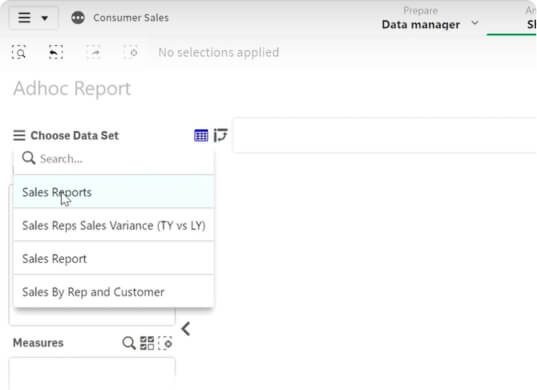
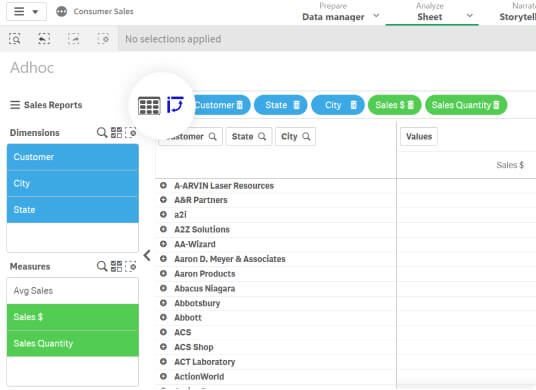
Make complex analysis simple. Bring
together multiple Dimensions with a Measure or multiple Measures with a Dimension
dynamically and analyse them in-the-moment. Seamlessly experiment with custom
labels,
axis positions, null values,
calculated columns or expressions beyond standard capabilities in Qlik.
Level-up the
vibrance of your charts
Elevate the visual tone of your
charts.
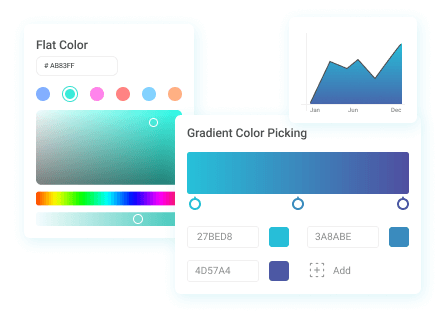
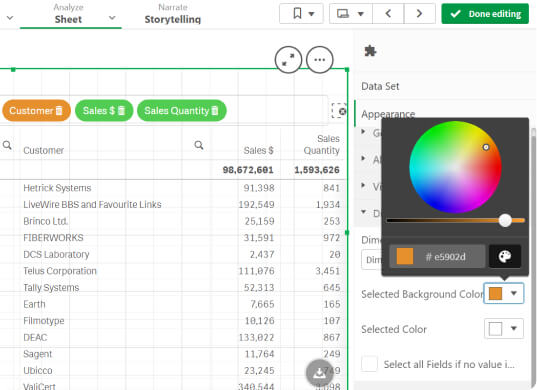
Explore variations with single or custom colours, define them by Measures or
Dimensions or by their inheritance from Masters. Set your charts apart with gradient
fills, grid and background colours
based on conditions. Compliment with custom visual formatting and positioning for
labels.
Enhance
interactivity with elements
Bring more imagination while
interacting
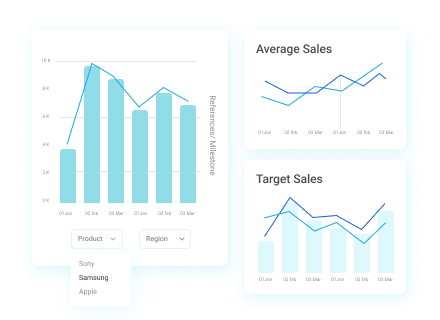
with charts. Add HTML tool tips that increase the power of analysis, introduce
mini-charts within them, add filters for navigation and much more. Include custom
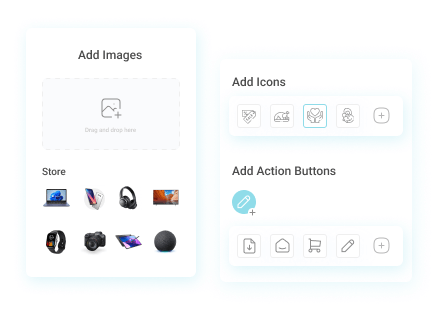
reference lines, dynamic icons or
illustrations to highlight milestones and images to enrich interactivity of your
charts
within a frame.
